Hearing Screening Alternative Using a Website-Based Application
Article information

Abstract
Background and Objectives
Indonesians encounter several barriers to regular functional hearing assessment. Hearing loss screening is only provided by tertiary-care hospitals that are not reachable by people in remote regions. This study aimed to develop a website-based hearing screening application that is accessible and inexpensive.
Subjects and Methods
This comparative study was conducted between July and August 2022 in the Otolaryngology Clinic of Muhammadiyah Bandung Hospital with noise levels below 50 dB. The hearing screening was conducted using a website-based application (www.Screenout.id) and audiogram as the gold standard method. On ScreenOut, patients heard sounds with frequencies at 500, 1,000, 2,000, 4,000, and 8,000 Hz and sound intensity of each frequency at 35, 55, and 75 dB using earphones.
Results
A total of 133 participants were enrolled in our study. ScreenOut showed high sensitivity, specificity, accuracy, positive predictive value, and negative predictive value (90.9%, 98.9%, 93.6%, 99.4%, and 84.8%, respectively). Regarding hearing threshold, a very strong correlation was found between ScreenOut and audiogram, ranging between r=0.843 and r=0.899. Aside from that, there was no significant difference in hearing threshold values between ScreenOut and audiogram.
Conclusions
Many advantages of the ScreenOut were found, including low-cost, accessibility, and easy-to-use interface, making it favorably used in low–middle-income countries such as Indonesia.
Introduction
Indonesians encounter several barriers to having their hearing function assessed regularly, even though hearing is one of the five important senses. Audiogram is the gold standard for examining hearing function, but not all hospitals in Indonesia provide audiogram examinations due to its expensive cost and audiogram procurement required subsidies from the government [1,2]. Aside from that, there is also an assumption that hearing screening is not a priority since hearing loss is not an emergent condition needing prompt medical care. Due to the reasons above, the screening can only be conducted in tertiary-care hospitals located in Indonesia’s urban area. To access those services, patients spend more for transportation and accommodation causing economic burden for most patients considering that the number of low-income population in Indonesia is as many as 26.16 million people (9.54%) [3,4].
An alternative hearing screening method, that is accessible and affordable by Indonesians, is needed so that hearing screening can be accessed equally. A website-based application hearing screening is proposed as a new alternative in Indonesia because of its accessibility. The proposed method is relatively inexpensive, simple, and feasible since it does not require complex equipment and the skill of trained health workers that audiogram requires. Many studies have been carried out to develop a smartphone-based hearing loss screening method to be able to conduct early hearing loss screening examinations with easy access and low cost [1,5-11]. Studies developing smartphone-based or website-based hearing screening found that both methods had sensitivity and specificity that are comparable to audiograms [6,10,12-14].
In Indonesia, there is no previous study that develops a smartphone-based or a website-based hearing screening. The aim of our study is to develop a website-based application hearing screening model that is comparable to an audiogram and is able to overcome the barriers that occur in Indonesia. In the future, we hope that this website-based application can be proposed as an alternative hearing screening in Indonesia to detect hearing loss.
Subjects and Methods
Study design and subject enrollment
This comparative study, approved by the Ethics Committee of Hasan Sadikin General Hospital (1043/UN6.KEP/EC/2021), was conducted from July 2022 to August 2022. All participating subjects provided written informed consent. Subjects were enrolled consecutively and randomly. The inclusion criteria were subjects diagnosed with hearing loss on anamnesis and physical examination and subjects with normal hearing who agreed to participate in the study by signing informed consent. The exclusion criteria were subjects who did not agree to participate in the study.
Procedure
Examination of hearing loss using audiometry is usually conducted in a sound-attenuating room with a relatively low sound intensity, at 25 dB. However, examination of hearing loss using ScreenOut in our study was conducted in an examination room in the Otolaryngology Clinic of Muhammadiyah Bandung Hospital, with a sound intensity of under 50 dB. When calibrated, the sound intensity was proportional to the sound intensity in a sound-attenuating room [15].
One study examined hearing loss in an empty examination room using a calibrated sound intensity that was proportional to the sound intensity in a sound-attenuating room. The study employed 35 dB as the lowest sound intensity tested in an empty examination room [16]. Thus, we used a sound intensity of 35 dB as the lowest sound intensity referencing the previous published results by other researchers [15,16].
Sound production for website-based hearing test
A sound recording that is proportional to the sound frequency of the audiogram for the hearing screening test was performed in the recording studio. A sound generator was used to produce sound with frequencies at 500, 1,000, 2,000, 4,000, and 8,000 Hz and the sound intensity of each frequency at 35, 55, and 75 dB.
The audio results from the sound generator that had been successfully recorded were then converted into files in WAV format, with the sample rate of 44,100 kHz, 24 bit. The hearing screening module was built according to the Business Process Model and Notation (BPMN).
Hearing test
The hearing screening was conducted using a website-based application (www.Screenout.id) and audiogram (OSCILLA SM.-950; Oscilla, Aarhus, Denmark) as the gold standard. All subjects were examined first using ScreenOut and followed by audiogram. The screening was carried out on the right ear first and followed by the left ear. On the website-based hearing test, patients heard sounds from the website by using earphones/headphones with frequencies of 500, 1,000, 2,000, 4,000, and 8,000 Hz and sound intensity at each frequency of 35, 55, and 75 dB. The order of frequency and intensity of the sound was: 500, 1,000, 2,000, 4,000, 8,000, 1,000, and 500 Hz (35, 55, 75 dB).
The increase in sound intensity intervals in this study; namely from 35 dB, 55 dB, and 75 dB; is based on the classification of hearing loss by the American National Standards Institute, in which we took the average of each classification. The classification of hearing loss based on the American Standards Institute [17] is as follows: 1) mild hearing loss: 26 to 40 dB; 2) moderate hearing loss: 41 to 55 dB; and 3) severe hearing loss: 71 to 90 dB.
Statistical analysis
Hearing test data from audiogram and ScreenOut were analyzed using SPSS, Version 18 (SPSS Inc., Chicago, IL, USA). Analysis of sensitivity, specificity, accuracy, negative predictive value (NPV), positive predictive value (PPV), and Spearman rank correlation coefficient was performed.
Results
A total of 133 subjects were included in this study. Fiftynine subjects (43.36%) were male and 74 subjects (55.64%) were female. Subjects’ ages ranged from 8 to 84 years, with a median of 50 years (Table 1). Screening for hearing loss was conducted using ScreenOut website-based application and then compared with an audiogram. Hearing loss examination was measured in the frequency range of 500 Hz to 8,000 Hz. The results of the study are presented in the following table (Tables 1-3).

Subjects’ age and sex distribution
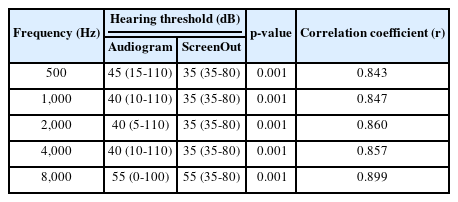
Hearing threshold of each examined frequencies on audiogram and website-based application ScreenOut (n=266)

Comparison of hearing screening results between audiogram and website-based application ScreenOut
Table 2 illustrates that the results of measuring the hearing threshold through examination through ScreenOut applications of various frequencies had lower median values when compared to audiogram examination. There was a very strong correlation of the hearing threshold between ScreenOut and audiogram, ranging from r=0.843 to r=0.899. Statistical analysis showed that hearing loss screening with ScreenOut had high sensitivity, specificity, accuracy, PPV, and NPV of 90.9%, 98.9%, 93.6%, 99.4%, and 84.8%, respectively (Table 3). Furthermore, the correlation analysis revealed a very strong correlation between ScreenOut and audiogram. Aside from that, there was no significant difference in hearing threshold values between ScreenOut and audiogram (mean difference [95% CI]=-2.80 [-4.61; -0.996] on the right ear and mean difference [95% CI]=-5.88 [-7.65; -4.12] on the left ear).
Discussion
In Indonesia, research developing a website-based application for early detection of hearing loss has never been carried out. Our research is essential in developing a website-based application with high sensitivity, specificity, and accuracy as compared to audiogram, which is the gold standard for hearing loss screening. Aside from that, in Indonesia, there is no alternative method of hearing loss detection other than audiogram, that can be reliably used as a reference for further examination or hearing loss therapy.
A website-based application as an alternative to audiograms for hearing screening offers the opportunity to detect hearing loss in a simpler and more inexpensive manner. These features are suitable to use in developing countries such as Indonesia with a maldistribution of health facilities, a large number of low-income population, and geographical constraints to access health services. This website-based application can pose as the first screening tool, as the results of hearing screening can act as the basis for referrals so that patients receive further hearing loss examinations and therapy. Smartphone-based applications and websites for hearing loss screening have been developed by several developed countries, but this has never been developed in Indonesia [8-10,12]. Uhear, Audcal, Audicus, and Easy Hear are several smartphone-based applications that have been validated for hearing loss screening [12]. The website-based hearing screening application that we have developed is called ScreenOut.
Applications for hearing screening as an alternative to audiograms should be comparable to audiograms in terms of sensitivity, specificity, and accuracy. Our study found that the cutoff value of 35 dB on ScreenOut had a sensitivity and specificity of 90.9% and 98.9%, respectively to detect hearing loss. This value is excellent when compared to other mobile-based applications. Uhear, a phone-based application for hearing screening, demonstrated that when screening for moderate or severe hearing loss in adults (pure tone average of >40 dB), high sensitivity (98.2%–100%) was achieved. However, the specificity varied (60.0%–82.1%) if screening was carried out in an environment with a noise level of around 40–50 dBA (quiet room) [9,18]. Ambient noise levels had a significant impact on the accuracy of Uhear [18]. The sensitivity of Uhear remained high across all test settings, whereas the specificity decreased in the waiting room setting (noise >50 dBA) and increased in a soundproof room (noise <40 dBA) [9]. Early detection of hearing loss has proven to be beneficial in early treatment and identification of etiologies. ScreenOut’s high specificity and sensitivity make it a proficient tool for early detection of hearing loss.
This research is important because, in Indonesia, there is no alternative method for early hearing loss detection other than audiogram. Meanwhile, audiogram is relatively expensive and usually only available in large hospitals in Indonesia. Consequently, it is inaccessible to the majority of Indonesia population since there is a high number of low-income population especially in rural areas. Aside from that, Indonesia’s geographical condition, that of an archipelago with islands, also poses an obstacle to accessing hearing screening services. Due to the aforementioned reasons, there is a need for hearing loss detection method that can be easily accessed by all Indonesian citizens at a relatively low price and without the need for audiologist. We hope that an alternative screening method for hearing loss can be created through our study so that hearing loss can be detected early with better prognosis.
In conclusion, ScreenOut is an excellent screening tool for hearing disorders due to its low-cost, accessibility, and easy-to-use interface.
The present study had some limitations. The test is not accessible without internet access that it cannot be used in more remote areas. There is no standardization of the use of earphones/headphones which can affect the results.
In conclusion, a website-based application for hearing assessment may aid people in low-resource settings to be able to detect hearing loss earlier. Our study showed that ScreenOut website was able to screen hearing loss with high sensitivity and specificity. ScreenOut can serve as a screening test before the patient is tested further with the more advanced examinations and can provide early warning of hearing loss. Further studies are needed for regular website calibration and for providing standardized operational procedures to implement ScreenOut in remote areas.
Acknowledgements
This study received funding from Academic Leadership Grant (ALG), Universitas Padjadjaran. The funding bodies had no role in the design of the study and collection, analysis, and interpretation of data, or in writing the manuscript. We would like to thank Abida Hasna Laila, M.D. for her linguistic contribution to the manuscript.
Notes
Conflicts of Interest
The authors have no financial conflicts of interest.
Author Contributions
Conceptualization: Tety Hadiaty Rahim. Data curation: Tety Hadiaty Rahim, Deni Kurniadi Sunjaya. Formal analysis: Deni Kurniadi Sunjaya. Funding acquisition: Dany Hilmanto. Investigation: Tety Hadiaty Rahim, Deni Kurniadi Sunjaya, Wijana Hasansulama. Methodology: Tety Hadiaty Rahim, Deni Kurniadi Sunjaya, Dany Hilmanto. Project administration: Dany Hilmanto. Resources: Tety Hadiaty Rahim. Software: Frans Zefanya Putra. Supervision: Deni Kurniadi Sunjaya, Wijana Hasansulama. Validation: Tety Hadiaty Rahim, Deni Kurniadi Sunjaya. Writing—original draft: Tety Hadiaty Rahim. Writing—review & editing: all authors. Approval of final manuscript: all authors.