Dynamic Range and Neural Response Threshold in Cochlear Implant Mapping Can Be Useful in Predicting Prognosis Related to Postoperative Speech Perception
Article information

Abstract
Background and Objectives
To analyze mapping changes in dynamic range (DR) and neural response threshold (NRT) as prognostic factors for cochlear implant (CI). To analyze whether postoperative speech perception performance could be predicted using DR change and initial NRT.
Subjects and Methods
The speech comprehension data of 33 patients with CI were retrospectively analyzed after 1, 3, 6, and 12 months of device use. All subjects were adult, postlingually hearing-impaired, and Cochlear Nucleus CI users. Speech perception performance was evaluated using aided pure tone audiometry, consonant, vowel, one-word, two-word, and sentence tests.
Results
The averages of initial NRT and DR changes were 197.8±25.9 CU (104–236) and 22.2±18.4 CU (-15–79), respectively. The initial DR was 40.8±16.6 CU. The postoperative DR was 50.3±16.4 CU at 3 months, 58±12.3 CU at 6 months, and 62.9±10.4 CU at 12 months. A gradual increase of DR was observed during the first year of CI. Compared with the initial DR, significant increases in DR were observed at 3 (p<0.05), 6 (p<0.001), and 12 (p<0.001) months. Compared with initial speech performance outcomes, a significant gain in all performance outcomes was achieved at 12 months (p<0.001).
Conclusions
Patients with low NRT after CI surgery could initially set DR to a wider range and had better final speech perception outcomes. Conversely, patients with high NRT after CI surgery had to set up a gradual increase in DR while adjusting the T-C level, and the final speech perception outcomes were worse. DR and NRT, the main CI mapping variables, can help predict prognosis related to speech perception outcomes after CI surgery. In conclusion, the post-CI speech perception is better with a lower initial NRT, wider final DR, or younger age.
Introduction
Cochlear implantation is an effective hearing rehabilitation surgery for severe hearing loss, which cannot be corrected, even with a hearing aid [1-3]. Cochlear implants (CIs) have revolutionized the treatment of moderate to severe sensorineural hearing loss by enabling individuals to perceive sounds and communicate more effectively [3]. Recently, CI surgery has shown an upward trend with early detection of prelingual deafness in babies through the national newborn hearing screening [4-7].
In the latest CI field, device hardware and software are rapidly evolving along with the improvement of CI surgical skills [8]. Advances in devices and technology have increased the success rates of CIs and postoperative hearing results [2,9]. Despite significant advances in CI technology and surgical techniques, thorough management and quality control of mapping and auditory rehabilitation in terms of postoperative speech perception have not yet been addressed.
CI mapping refers to the customized programming of a CI according to a user’s specific needs, and allows the user to hear an optimal sound from the electrodes of the CI array [2,10]. Mapping consists of various factors, such as setting the T-level (threshold) and C-level (comfortable) and adjusting various parameters including pulse width (stimulation rate control), sensitivity (fine adjustment of sound processor), and volume [2,10]. In practice, postoperative rehabilitation, including mapping and speech therapy, is crucial to obtain maximum output after CI surgery [11,12].
Potential factors that may contribute to post-CI speech perception are dynamic range (DR) and neural response threshold (NRT) in CI mapping [13-16]. Neural response threshold is the minimum level of electrical stimulation required to elicit a response (sensitivity) from auditory nerve fibers, and is an objective measure of the effectiveness of CIs [13-16]. Dynamic range refers to the range of loudness levels and electrical current amplitudes that a patient can perceive through their implant (C level–T level: the difference between the level of maximum comfort [C level: the highest tolerable current level without any discomfort or pain] and the threshold of perception [T level: the lowest current level at which the patient can detect sound]) [13-16].
Both DR and NRT are important predictors of postoperative speech perception; however, the exact relationship between these measures and speech outcomes is unclear. Clinicians can more accurately predict patient prognosis and customize the CI mapping and rehabilitation programs through an improved understanding of this relationship [17]. This study aimed to measure the results and changes in NRT, DR, and speech perception test outcomes over time after CI surgery, analyze the correlations among DR, NRT, and other variables affecting speech perception, and determine whether speech perception outcomes following CI surgery can be predicted using variables, such as initial NRT and changes in DR.
Subjects and Methods
This was a retrospective study. We analyzed the mapping data of patients with CIs between January 2019 and January 2022. The inclusion criteria were as follows: 1) postlingual hearing loss, 2) CI mapping for at least 1 year in a tertiary hospital CI center, 3) “Cochlear Nucleus” (Cochlear®, Macquarie University, NSW, Australia)” CI user, 4) CI use for >8 hours daily, 5) no inner ear anomalies, 6) no central nervous system disease, 7) those who can obtain the results of cochlear implant mapping and speech evaluation/treatment for at least one year after surgery, and 8) those who consent to the study.
We analyzed CI performance using the categorical auditory performance, Ling’s 6 sound test, speech perception test, and sound field test. The mapping characteristics focused on variables associated with stimulus intensity (C level, T level, DR, and input DR) and fine-tuning (pulse width, sensitivity, volume, frequency allocation, and stimulation rate). The information database includes age, sex, intra-op/initial NRT, mapping data (impedance, DR), sound field threshold (CIaided pure tone audiometry), and speech perception tests (vowel, consonant, one word, two word, sentences test) [18]. Korean Central Institute for the Deaf (KCID) sentence test was used as speech performance test for sentences, which is an updated and used tool that has been validated through previous research [19,20]. Key variables were collected according to the initial, 3 months, 6 months, and 12 months periods. This study was approved by the Institutional Review Board of the Korea University College of Medicine (KUMC IRB AN0509).
The correlation between final DR and initial NRT was studied. The correlation between DR change 1 year after surgery and initial NRT was studied. The final result of sentences test, a representative speech perception test, was compared with final DR, DR change, initial NRT, and age, respectively. Other nonsignificant correlations were not shown in the results. Final DR, which is considered a representative prognostic factor for cochlear implants, was correlated with all speech perception tests.
Statistical analysis
All values were presented as the mean±standard deviation using SPSS 13.0 software (SPSS Inc., Chicago, IL, USA) and Excel 2019 (Microsoft Corp., Redmond, WA, USA). The multiple data in the information database were analyzed using repeated measures analysis of variance (ANOVA) with Tukey multiple comparisons posttest. The correlation between major variables was analyzed by multiple regression. Statistical significance was set to p<0.05.
Results
Thirty-three patients who underwent CI surgery were included in the study. The mean age of the patients was 40.1±17.6 years (range: 11 to 74 years). The operative side of the ear and sex distribution were as follows: right/left, 16/17 and male/female, 14/19. The initial NRT was 197.8±25.9 CU, and NRT at 12 months post-CI was 191.8±27.6 CU. In this study, the NRT considered was the initial NRT (switch-on NRT [1-month post-CI]), after first installing an external CI speech processor. All speech perception tests, including vowel, consonant, one or two-word, and sentence tests, conducted 1 year after CI surgery showed significantly improved results than the initial data (Table 1). The average duration of CI use was 10.7±6.1 years.

Clinical results of patients who underwent cochlear implantation
After CI surgery, the DR significantly widened over time. It increased significantly at 3, 6, and 12 months compared with that in the initial month. The DR at initial stage, 3, 6, and 12 months postoperatively was 40.8±16.6 CU, 50.3±16.4 CU, 58.0± 12.1 CU, and 62.9±10.4 CU, respectively (Fig. 1). During the first year of CI use, a gradual increase in DR was observed. Compared with the initial DR value, significant increases in DR were observed at 3 (p<0.05), 6 (p<0.001), and 12 months (p<0.001).
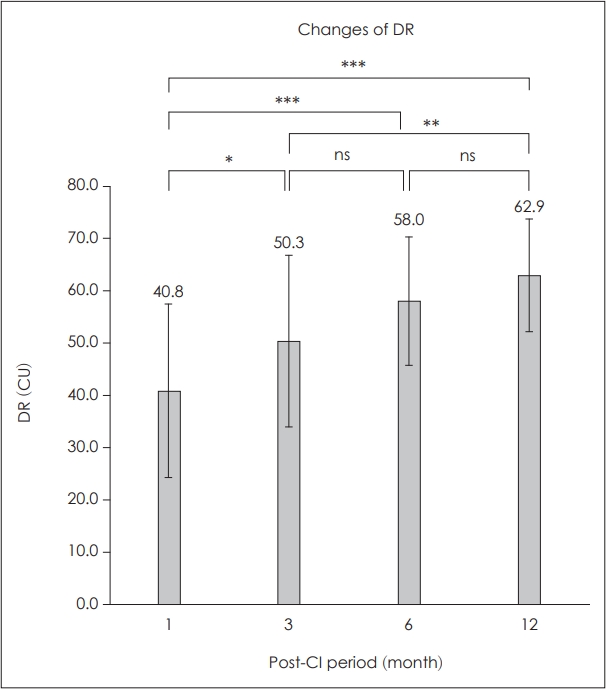
Outcomes of dynamic range (DR). During the first year of cochlear implants (CI), gradual increase of DR was observed. Compared with initial DR value, significant increases of DR were observed at 3 months (*p<0.05), 6 months (***p<0.001), and 12 months (***p<0.001). **p<0.01.
Speech perception outcomes significantly increased over time after CI placement. Speech perception tests included vowel, consonant, one- and two-word, and sentence tests. Even with the most difficult sentence test, speech perception significantly improved at 3, 6, and 12 months compared to that before CI surgery (Fig. 2). As shown in Table 1, initial speech perception outcome was 46.0%±22.3% in vowel, 36.7%± 21.2% in consonant, 28.3%±24.5% in one-word, 34.8%±28.1% in two-word, and 25.8%±34.0% in sentence tests. Three months postoperatively, speech perception outcome was 64.8%±21.0% in vowel, 53.5%±24.0% in consonant, 48.3%±26.8% in oneword, 54.2%±30.3% in two-word, and 48.6%±33.4% in sentence tests (p<0.01). Six months postoperatively, speech perception outcome was 76.8%±15.7% in vowel, 64.2%±19.9% in consonant, 58.7%±22.0% in one-word, 65.6%±25.5% in twoword, and 62.0%±32.5% in sentence tests (p<0.001). Twelve months postoperatively, a significant gain in speech perception outcome was achieved as 78.7%±18.6% in vowel, 77.8%± 17.7% in consonant, 73.4%±20.0% in one-word, 75.1%±22.0% in two-word, and 72.6%±27.8% in sentence tests (p<0.001). Initially, speech performance in the vowel test was better than that in the other tests, particularly the sentence test. However, the final outcomes of all five speech perception tests were similar (Fig. 2).
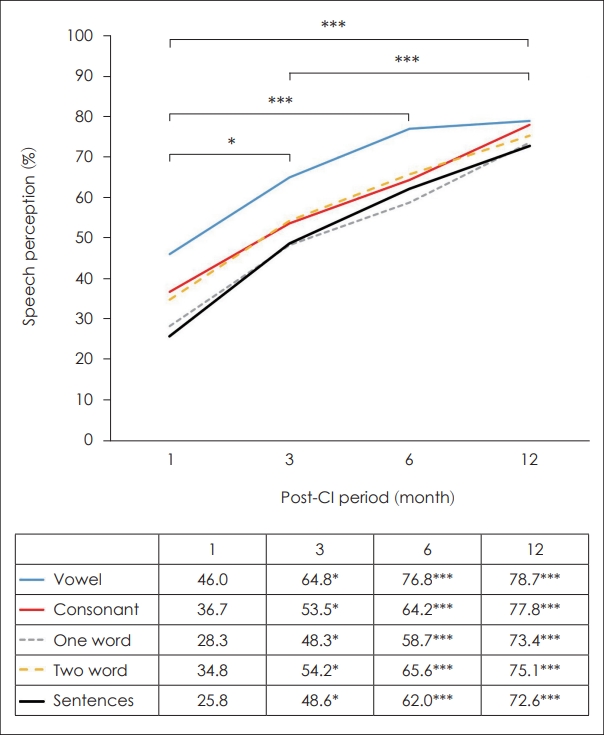
Outcomes of speech perception tests. Compared with initial speech perception test, significant improvements were observed at 3 months (*p<0.05), 6 months (***p<0.001), and 12 months (***p<0.001). Initially, speech performance in the vowel test was better than other tests, especially sentence test. However, all five tests had a similar final outcome of speech perception tests.
Fig. 3 shows the correlation between DR and NRT. In the correlation between final DR and NRT, the average final DR was 61.9±10.6 CU. If the switch-on NRT was low and stable, the final DR was wide, and if the switch-on NRT was high, the final DR was narrow (Fig. 3A). The correlation between the final DR and NRT was significant (p<0.05). When the switchon NRT was low and stable, the final DR could be set widely from the beginning; therefore, the change in DR during CIrehabilitation in the postoperative 12 months was minimal (Fig. 3B). However, the final DR needed to be set narrowly at first when the switch-on NRT was high; therefore, the change in DR during CI-rehabilitation in the postoperative 12 months was large (Fig. 3B). However, the association between the final DR and NRT was not significant.
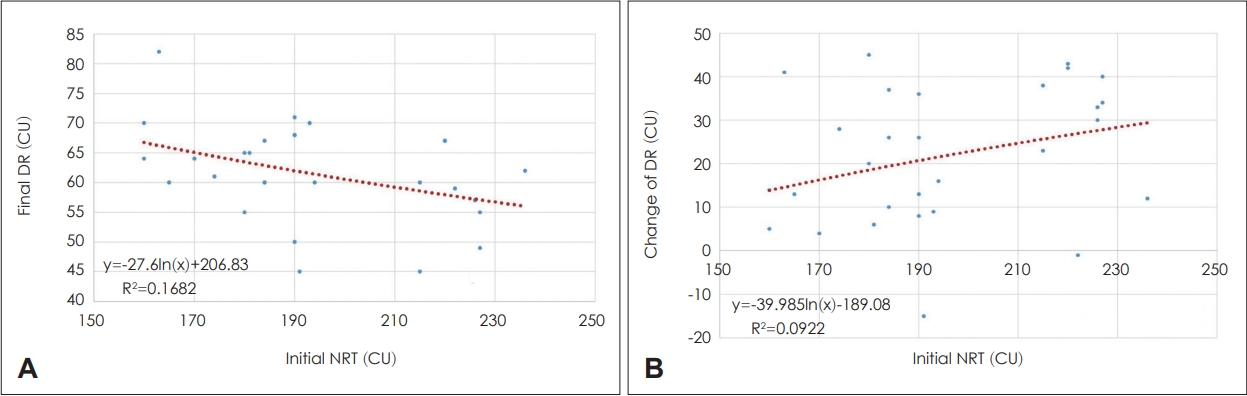
Correlation between dynamic range (DR) and initial neural response telemetry (NRT). A: Correlation between final DR and initial NRT. The average of final DR was 61.9±10.6 CU (min: 44, max: 102). If the switch-on NRT is low and stable, the final DR is wide, and if the switch-on NRT is high, the final DR is narrow. Correlation between the final DR and NRT was significant (p=0.03). B: Correlation between the change in DR and initial NRT. If the switch-on NRT is low and stable, final DR can be set widely from the beginning; therefore, there is a minimal change in DR during CI-rehabilitation in the 12 months postoperatively. In contrast, if the switch-on NRT is high, the final DR needs to be set narrowly at first, so the change in DR is large during CI-rehabilitation in the 12 months postoperatively. However, the association between the final DR and NRT was not significant (p=0.10).
Fig. 4 shows the correlation between speech perception test outcomes and various factors. In the correlation between the final sentence test outcome (STO) and final DR, the final DR was directly proportional to the STO, indicating better speech perception (Fig. 4A). The correlation between the STO and final DR was statistically significant (p<0.01). The STO worsened with more changes in the DR (Fig. 4B). When the initial DR was narrowed and gradually widened, it indicated a difficult initial rehabilitation. However, the correlation between the STO and changes in DR was not significant. In the correlation between the STO and NRT, the initial NRT was inversely proportional to the final STO (Fig. 4C). The correlation between the STO and NRT was statistically significant (p<0.01). In general, the STO was inversely proportional to age and was better in younger patients than in older patients (Fig. 4D). The correlation between the STO and age was statistically significant (p<0.05).
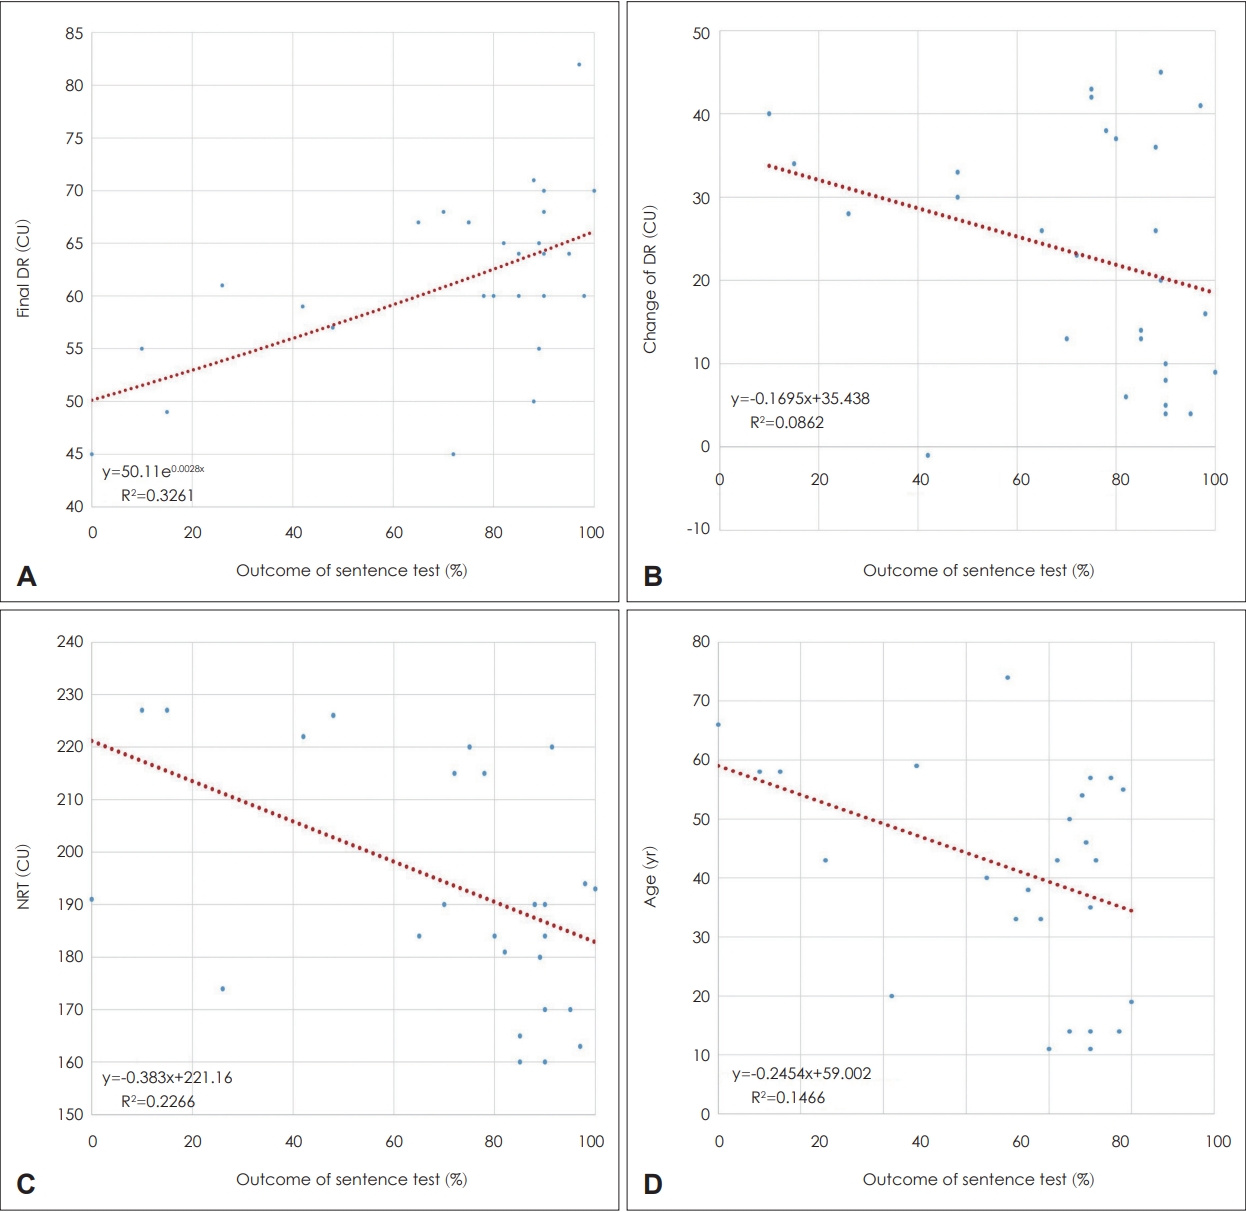
Correlation between outcomes of speech perception tests and various factors. A: Correlation between sentence test outcome (STO) and final dynamic range (DR). Improved speech perception is observed with a wider final DR and a higher STO. The correlation between the STO and final DR was statistically significant (p<0.01). B: Correlation between the STO and change in DR. The STO worsened with more changes in the DR. If the DR was narrowed at first and gradually increased, it was interpreted as a difficult initial rehabilitation. However, the correlation between the STO and change in DR change was not significant (p=0.12). C: Correlation between the STO and initial neural response telemetry (NRT). An improved final STO was seen with a smaller initial NRT. The correlation between the STO and NRT was statistically significant (p<0.01). D: Correlation between the STO and age. In general, the STO was improved at a younger age worsened with age. The correlation between the STO and age was statistically significant (p<0.05).
Fig. 5 shows the correlation between speech perception outcomes and the final DR. All speech perception tests, including vowel, consonant, one- or two-word, and sentence tests showed statistically improved results at 1 year postoperatively compared that in the initial data. In all speech perception tests, better results were obtained with a wider final DR (p<0.01).
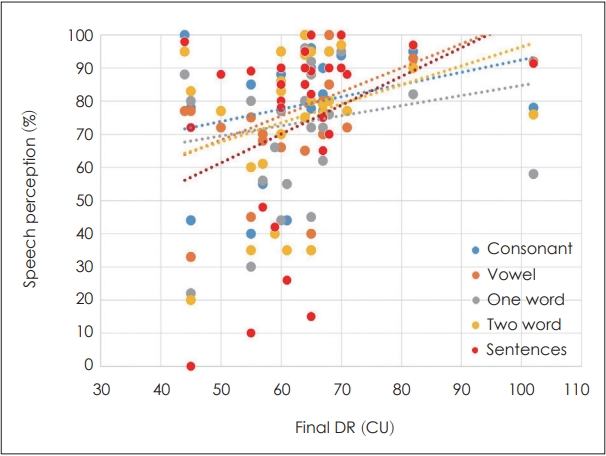
Correlation between the outcomes of speech perception tests and the final dynamic range (DR). All speech perception tests, including vowel, consonant, one- or two-word, and sentence tests showed statistically improved results at 1 year after cochlear implant surgery compared to the initial data. In all speech perception tests, better results were observed with a wider final DR (p<0.01).
Discussion
In this study, the major variables of CI mapping can be useful in predicting the prognosis associated with postoperative speech perception outcomes. Speech perception after CI is better with a lower initial NRT, wider final DR, and younger age than that with a higher initial NRT, narrower final DR, and older age. Although the difference was not statistically significant, the DR changed slightly when the NRT was low and showed a large change when the NRT was high (Fig. 3B). Additionally, when the change in DR was small, the speech perception outcome was good, whereas when the change in DR was large, the speech perception outcome was poor. Additionally, there was a negative correlation between speech perception outcomes and age.
Patients with CI having a low initial NRT and a stable CI can set a wider DR from the beginning of mapping with a good speech perception outcome. In addition, when the change in the DR over time is small, a good speech perception outcome is eventually achieved. Hence, a person with a good starting point will also have a good final result. When the initial NRT is high, the DR set initially is narrow or the change in DR does not increase during postoperative mapping and rehabilitation. Therefore, we can possibly predict that the speech perception outcomes of such patients with CIs will be worse than desired.
Other studies have evaluated the relationship between the DR and speech perception in CI users. One study found that CI users with a wider DR had better speech perception scores than those with a narrower DR [21]. Another study found that a wider DR produced optimal speech recognition in CI users [22-24]. In sequential cochlear implants, the DR is usually narrower in the second CI and the speech perception ability is poor, which also proves the correlation between DR and CI prognosis [14]. Conversely, one study failed to identify a clear relationship between DR and speech perception [25].
A low initial NRT and a wide final DR were clearly correlated with a better STO in this study. Considering that the change in DR had no clear correlation with STO, some CI users with a high initial NRT and narrow DR had better STO as their DR widened over time. In contrast, there were some participants whose DR did not adequately widen over time and had a poor STO. In such patients, speech perception did not improve as desired. It was assumed that the change in DR was not identified as a significant factor because CI users with a high initial NRT and narrow DR produced varied STO results and lapses (Supplementary Fig. 1 in the online-only Data Supplement). Therefore, when the initial NRT is high or the DR is narrowly set, special attention should be paid to CI mapping. In addition, if the rate of change in DR in the wide direction is slow in CI users with a high initial NRT and a narrow DR, CI mapping and auditory rehabilitation should be performed more frequently and with special care.
This study suggested that DR and NRT may be important factors for predicting postoperative speech perception in CI users. Further studies are warranted to confirm these findings. This study had a few limitations. First, the sample size was small and the follow-up period was not adequately long. Future studies should include larger sample sizes and longer follow-up periods to better assess the relationships between DR, NRT, and speech perception among CI users. Second, neonatal CI users were excluded from this study because changes in DR took a protracted amount of time, and speech perception tests were difficult to perform in neonates.
In conclusion, final DR and initial NRT can be useful in predicting speech perception outcomes after CI surgery.
Supplementary Materials
The online-only Data Supplement is available with this article at https://doi.org/10.7874/jao.2023.00374.
Supplementary Fig. 1.
Individual speech perception test data of 33 patients who underwent cochlear implant (CI) surgery. This graph shows the results of the KCID (Korean Central Institute for the Deaf) sentence test at 1, 3, 6, and 12 months after CI surgery for all patients.
Acknowledgements
This research was supported by a grant of the Korea Health Technology R&D Project through the Korea Health Industry Development Institute (KHIDI), funded by the Ministry of Health & Welfare, Republic of Korea (grant number: HR22C1302). This work was supported by Korea University Research Fund (K2306671, K2310471, K2306031, K2208471, K2205081, K2125741, K2211761). These funding sources provided only financial support and played no specific scientific role in this study.
Notes
Conflicts of Interest
The authors have no financial conflicts of interest.
Author Contributions
Conceptualization: Gi Jung Im, Pyung Kon Thak. Data curation: Gi Jung Im. Formal analysis: Gi Jung Im. Funding acquisition: Gi Jung Im. Methodology: Gi Jung Im, Pyung Kon Thak. Project administration: Gi Jung Im. Validation: Gi Jung Im, Pyung Kon Thak, Euyhyun Park, Bongil Park. Visualization: Gi Jung Im. Writing—original draft: Gi Jung Im, Pyung Kon Thak, Euyhyun Park, Bongil Park. Writing—review & editing: all authors. Approval of final manuscript: all authors.