Parameter Optimization for Applying the Prepulse Gap Paradigm to Humans
Article information
Abstract
Background and Objectives
Turner and colleagues introduced a new method that can detect tinnitus in animals. The stimulus is composed of a small background noise that is identical to the pitch of the tinnitus and a large pulse noise that can evoke a startle response. In normal rats, the gap decreases the startle reflex. However, in tinnitus rats, the gap does not decrease the startle reflex. The goal of this study was to optimize the stimulation paradigm so that the prepulse inhibition of N1-P2 amplitude would be maximized in the normal human subjects.
Subjects and Methods
Seven normal control subjects without tinnitus were recruited. The stimulus was composed of two different sounds: the softer background noise and the louder pulse noise. A 50 msec silent gap was inserted before the pulse noise as the gap condition (G condition) but not in the no-gap condition (N condition). The averaged amplitude of the N1-P2 cortical response was recorded for the G and N conditions.
Results
The G/N ratio was the smallest when the gap was 20 msec prior to the pulse noise. The G/N ratio was 84.8±16.8% with the Hanning window and 78.5±5.9% without the window. The G/N ratio was 91.1±24.9%, 78.0±5.4%, and 79.0±18.1% when the intensity of the background noise was 10, 20, and 32 dB SL, respectively. When the intensity of the background noise was 20 and 32 dB SL, the N1-P2 amplitude of the G condition was significantly smaller than that of the N condition.
Conclusions
The optimal stimulus should be composed of the 1 kHz pulse noise without Hanning window. The intensity of the background noise should be 20 dB HL and the location of the gap should be 20 msec prior to the pulse noise. It seems that with these optimized parameters we could expect a 78.0% inhibition of N1-P2 amplitude in normal subjects without tinnitus.
Introduction
Conventional tinnitus animal models, such as Jastreboff's conditioned lick suppression or Bauer and Brozoski's conditioned lever pressing, requires time intensive training and it is possible that even properly trained animals could vary in their responses from each other. However, Turner, et al.1) introduced a new method that can detect tinnitus in animals. This method was defined as gap prepulse inhibition of acoustic startle (GPIAS) and has been used in many other studies.2-8) The stimulus is composed of a small background noise that is identical to the pitch of the tinnitus and a large pulse noise that can evoke a startle response. In normal rats, the gap decreases the startle reflex. However, in tinnitus rats, the gap does not decrease the startle reflex. It is presumed that the tinnitus fills in the silent gap, making it less salient, and reducing the amount of pre-pulse inhibition.8)
This method is quite convenient in that we can immediately test the animals for the presence or absence of tinnitus without the need for conditioned training. What we observed from this animal model is that it may also be applied to humans. For this animal model to work with human subjects, we need to first establish whether human beings are similarly influenced by the prepulse gap. Therefore, in our previous report, we studied whether humans' ability to detect a prepulse gap is also influenced by the presence or the absence of tinnitus.9) We found that the ability to detect prepulse gaps is significantly affected by tinnitus in humans, just as in the animal models. Based on the GPIAS model and our psychoacoustic results, we thought we could build an objective test that can detect tinnitus in humans. Recently, Fournier and Hébert10) has measured the blink startle reflex in humans with the GPIAS stimulation paradigm and found a significant difference between tinnitus subjects and normal controls. The prepulse gap inhibition ratio was 31% in tinnitus patients and 51% in normal controls. In this study, instead of using the startle reflex, we acquired cortical responses. The main outcome of this study was the inhibition ratio of the amplitude of N1-P2. N1-P2 is one of the long latency responses (80-100 msec). N1-P2 is presumed to originate from the auditory cortex.11) It has been postulated that the startle reflex is a brainstem based three neuronal sensorimotor reflex.12) Considering that the N1-P2 is also elicited by an acoustic sensory input, startle reflex and N1-P2 share the same acoustic sensory input pathway. Although more investigation is needed to precisely elucidate the neural mechanism of these two responses,13) identical sensory input neural pathway may serve as a basis for similar output patterns in terms of prepulse gap stimulus. Human electrophysiological evidence in tinnitus participants is rather equivocal: increased, reduced or no difference in N1 evoked amplitudes and latencies have been reported.14) But in the previous reports the N1-P2 cortical response was evoked by a single burst of pure tone and not a prepulse gap stimulus. Accordingly, N1-P2 response evoked by prepulse stimulus may be quite different from the former reports and reserves further study. But before applying this new test to tinnitus subjects, we needed to optimize the test so that the N1-P2 response would be sufficiently inhibited in normal controls. Therefore, the goal of this study was to optimize the stimulation paradigm so that the prepulse inhibition of N1-P2 amplitude would be maximized in the normal subjects.
Subjects and Methods
Subjects
Normal hearing subjects were enrolled to optimize the stimulation paradigm. Seven normal control subjects (six males, one female; mean age 29.4±2.9 years) without tinnitus were recruited. All of the subjects had normal hearing (<10 dB hearing level, HL) and no history of cochlear or vestibular disease. The tympanic membranes were proven to be normal in the both ears.
Stimulus design
Using our software program based on LabVIEW (National Instruments, Austin, TX, USA), the stimuli were created. Contents of the stimulus were as described in Fig. 1. The stimulus was composed of two different sounds: the smaller background noise and the louder pulse noise. The background noise lasted from 500 msec prior to a pulse noise to 880 msec after the pulse noise. The frequency of the background noise was 8 kHz. Several different intensity of the background noise was tried to optimize the stimulus, but it never exceeded 60 dB sound pressure level (SPL). The pulse noise lasted 20 msec and was set at 98-107 dB SPL according to the 1 kHz hearing threshold of the subject. The intensity of the pulse noise was strictly controlled below 107 dB SPL in order to prevent acoustic trauma of the ear. A 50 msec silent gap was inserted before the pulse noise as the gap condition (G condition). Several different locations of gap (time lag) was tried for optimization: gap far from the pulse noise (80 msec time lag) or gap very close to the pulse noise (0 msec time lag). For the no-gap condition (N condition), the background noise and pulse noise were not different from the gap condition. The only difference was that there was no gap and the background noise was continuous. The inter-stimulus interval was set as 0.715 Hz.
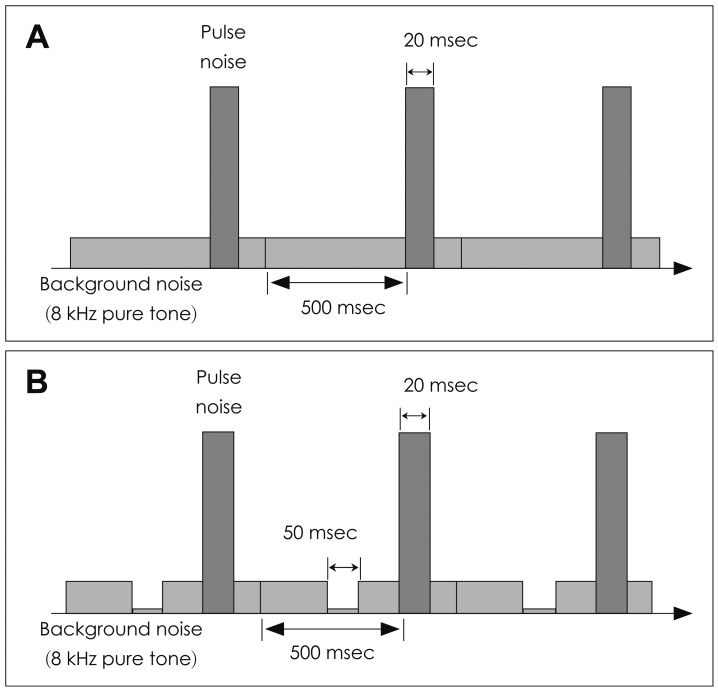
Parameters of the stimulus. The frequency of the background noise was 8 kHz. Several different intensity of the background noise was tried to optimize the stimulus, but it never exceeded 60 dB sound pressure level (SPL). The pulse noise lasted 20 msec and was set at 98-107 dB SPL according to the 1 kHz hearing threshold of the subject. The intensity of the pulse noise was strictly controlled below 107 dB SPL in order to prevent acoustic trauma of the ear. For the no-gap condition, the background noise and pulse noise were not different from the gap condition. The only difference was that there was no gap and the background noise was continuous (A). A 50 msec silent gap was inserted before the pulse noise as the gap condition (B).
Auditory evokes response system
To present the specially designed stimulus as previously described, the stimulus was generated from the LabVIEW based software program. USB-6216 digital-to-analog converting hardware (NI) and a XR-MS3 audio amplifier (AIWA, Tokyo, Japan) were used for signal generation. A MDR-Ex51 insert type earphone (Sony, Tokyo, Japan) was used as the transducer. The Viking IV evoked response system (Nicolet Biomedical, Madison, WI, USA) was used for cortical response acquisition. The cortical response was measured in the supine position in a quiet room. Two channel-electrodes were placed at Cz as a reference and at A1 and Fpz as active and ground, respectively. The sound stimulus and cortical response were temporally synchronized so that the responses could be averaged as a function of time (Fig. 2). N1-P2 responses were recorded from 100 gap stimuli. Next, the N1-P2 responses were recorded from 100 no-gap stimuli. The order of the G condition and the N condition was randomized in each subject to prevent habituation and exclude the effect of the subjects' expectations.

Diagram of the measurement system. To present the specially designed stimulus, the stimulus was generated from the LabVIEW based software program. Digital-to-analog converting hardware and a audio amplifier were used for signal generation. Insert type earphone was used as the transducer. A conventional evoked response system was used for cortical response acquisition. GND: ground.
Primary outcome measure
The averaged amplitude of the N1-P2 cortical response was recorded for the G and N conditions. The primary outcome measure was represented as the G/N ratio, calculated as G/N ratio=(N1-P2 amplitude in G condition)÷(N1-P2 amplitude in N condition)×100. Since the normal subjects do not perceive tinnitus, the cortical response should be inhibited by the prepulse gap and, consequently, the smallest G/N ratio was considered as the most optimal form of the parameter.
Optimization of the stimulus paradigm
The parameters that were optimized in this study were the 1) type of pulse noise, 2) location of the gap, 3) necessity of windowing the pulse noise, and 4) intensity of the background noise. 1) Concerning the type of pulse noise, 20 msec duration of white noise and 20 msec duration of 1 kHz sine wave were attempted. 2) The optimal location (time lag) of the gap was also tested using four different locations of the gap according to the duration between the gap termination and pulse noise initiation: 0, 20, 50, and 80 msec. 3) To minimize the signal distortion, we tested a Hanning window on the pulse noise. The pulse noise in this study included a 1 kHz sine wave with 20 msec duration. The rise time and fall time was set at 0 msec. This abrupt onset of pulse signal may give rise to distortion during the initiation and termination of the pulse signal. We evaluated the control of this factor by windowing the pulse noise signal. 4) The intensity of the background noise was also optimized. We tried three different intensities: 10, 20, and 32 dB SL. All the results were described in mean±standard deviation. Data were analyzed statistically using the Statistical Package for the Social Sciences software (SPSS, IBM, Somers, NY, USA). Difference between the G condition and N condition was compared statistically using Wilcoxon signed rank test. Differences were considered statistically significant using an alpha level of 0.05 throughout all analyses.
Results
1) Type of pulse noise: a clear N1-P2 was not evoked by the white noise burst in two subjects. Meanwhile, the N1-P2 was clearly recorded in all subjects by the 1 kHz sine wave (Fig. 3). 2) Location of the gap: the G/N ratio, according to the location of the gap, was 84.0%, 73.2%, 76.0%, and 104.8% for the 0, 20, 50, and 80 msec time points, respectively. The G/N ratio was the smallest when the gap was 20 msec prior to the pulse noise. The G/N ratio became larger when the gap was too close to the pulse noise. Also, the G/N ratio increased in a linear pattern when the duration from the gap to the pulse noise exceeded 20 msec (Fig. 4). 3) Necessity of windowing the pulse noise: the G/N ratio was 84.8±16.8% with the Hanning window and 78.5±5.9% without the window (Fig. 5). The G/N ratio was smaller when the Hanning window was removed. 4) Intensity of the background noise: the G/N ratio was 91.1±24.9, 78.0±5.4, and 79.0±18.1% when the intensity of the background noise was 10, 20, and 32 dB SL, respectively (Fig. 6). The G/N ratio was the smallest when the intensity of the background noise was set at 20 dB SL. Also the results seemed to be most consistent in this condition, showing the smallest standard deviation. In detail, when the intensity of the background noise was 10 dB SL the N1-P2 amplitude was 8.4±5.8 µV for the G condition and 9.5±3.5 µV for the N condition. This difference was not significant (p=0.345). When the intensity of the background noise was 20 dB SL the N1-P2 amplitude was 6.5±2.1 µV for the G condition and 8.8±3.0 µV for the N condition. The N1-P2 amplitude of the G condition was significantly smaller than that of the N condition (p=0.018). When the intensity of the background noise was 32 dB SL the N1-P2 amplitude was 7.8±3.0 µV for the G condition and 10.4±4.5 µV for the N condition. The N1-P2 amplitude of the G condition was also significantly smaller than that of the N condition (p=0.018).

Type of pulse noise and representative diagram of an improper and robust N1-P2 response. A clear N1-P2 was not evoked by the white noise burst in two subjects. Meanwhile, the N1-P2 was clearly recorded in all subjects by the 1 kHz sine wave.

Location of the gap. The G/N ratio, according to the location of the gap, was 84.0%, 73.2%, 76.0%, and 104.8% for the 0, 20, 50, and 80 msec time points, respectively. The G/N ratio was the smallest when the gap was 20 msec prior to the pulse noise. The G/N ratio became larger when the gap was too close to the pulse noise. Also, the G/N ratio increased in a linear pattern when the duration from the gap to the pulse noise exceeded 20 msec. G/N ratio=(G condition N1-P2 amplitude)÷(N condition N1-P2 amplitude)×100.
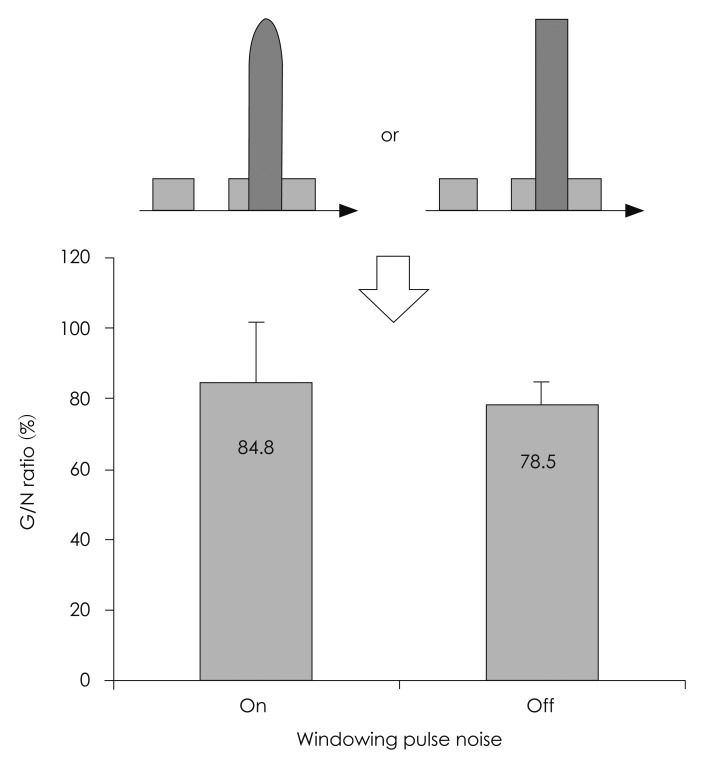
Necessity of windowing the pulse noise. The G/N ratio was 84.8±16.8% with the Hanning window and 78.5±5.9% without the window. The G/N ratio was smaller when the Hanning window was removed. G/N ratio=(G condition N1-P2 amplitude)÷(N condition N1-P2 amplitude)×100.
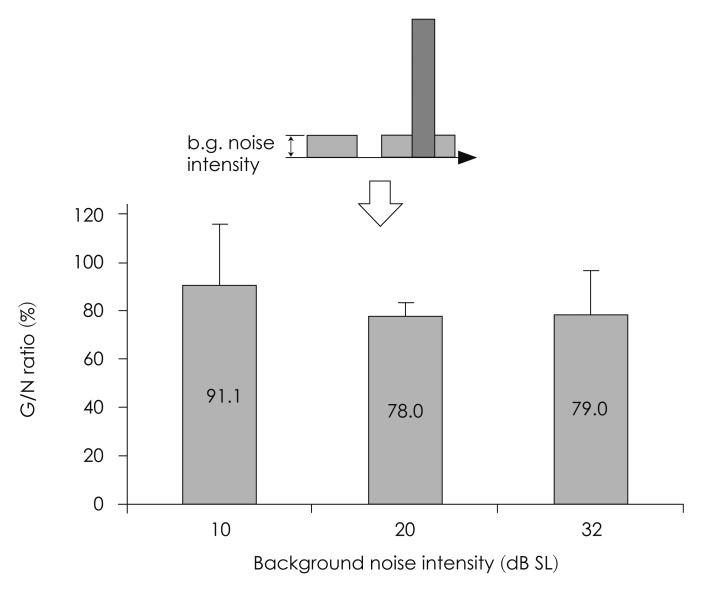
Intensity of the background noise. The G/N ratio was 91.1±24.9, 78.0±5.4, and 79.0±18.1% when the intensity of the background noise was 10, 20, and 32 dB SL, respectively. The G/N ratio was the smallest when the intensity of the background noise was set at 20 dB SL. Also the results seemed to be most consistent in this condition, showing the smallest standard deviation. G/N ratio=(G condition N1-P2 amplitude)÷(N condition N1-P2 amplitude)×100.
Discussion
The prepulse gap paradigm has been successfully applied in rodents to detect tinnitus objectively, but this paradigm has not been thoroughly studied in humans. In this study, using the N1-P2 cortical response and prepulse gap paradigm, we have attempted to elucidate an objective difference in the cortical response between G condition and N condition in normal controls. By optimizing the stimulus design, we have found that the cortical response was inhibited by the prepulse gap in normal controls up to 78.0%. We believe this observed inhibition may serve as a key to develop a more sophisticated and precise test that can objectively detect tinnitus in human patients in the future.
As for the auditory measurements, a standard pure tone audiometry or speech audiometry can be performed for a patient suspected of having a loss of hearing. If the results from these subjective tests are unreliable or if an objective documentation is required, an objective hearing test, such as the auditory evoked response test, can be performed. However, currently there is no clinically available test that can detect tinnitus objectively. Tinnitus is frequently associated with traffic accidents,15) and it is one of the most prevalent service-connected disabilities among U.S. veterans.16) In addition, occupational tinnitus is frequent among workers in industrialized countries and is one of the greatest occupational health hazards.17) Nevertheless, many of the victims or laborers are not compensated for their loss, because it is difficult to prove that their tinnitus even exists. While several psychoacoustic tests are available, they are all subjective and not objective. The tinnitus patient can easily exaggerate or minimize their symptoms, leading to inaccurate diagnoses. An objective tinnitus testing procedure is very desirable for the doctors making the diagnoses and for patients who wish to prove the diagnoses.
The reason for the inhibition in the N1-P2 response to the prepulse gap stimuli is not clear. As was postulated in the animal study, the short gap in the background noise may be recognized by the normal controls. And the neural processing of this preceding gap may inhibit the neural processing of the following main pulse noise, resulting in a smaller N1-P2 response. It has been known that a weak prestimulus (positive prepulse) inhibits the reaction of the subsequent strong startling stimulus (main pulse) in humans.18) And the prepulse gap (negative prepulse) may also induce a similar inhibition as the prestimulus (positive prepulse). Meanwhile, the short gap may be missed in tinnitus patient due to the similarity of the background noise and tinnitus. To demonstrate this phenomenon, previously, we performed a psychoacoustic study and found that the tinnitus patients had significant difficulty in perceiving the gap in between the 8 kHz pure tone.9) During the current study, we tried to perform a concomitant behavioral gap/no-gap detection task similar to our prior psychoacoustic study. It would have further supported our current results and hypothesis. But, this was not possible because a 50 msec gap was too short for the subjects to perceive. That is all the subjects failed in differentiating the gap stimulus from the no-gap stimulus. It is known that normal subjects can detect an auditory gap shorter than 50 msec.19) But, in our stimulation paradigm, there was a large pulse noise right after the gap making the discrimination between gap and no-gap very difficult. It seems that the difference in N1-P2 response between the two different groups is due to a central auditory process that cannot be perceived subjectively.
Although our hypothesis and stimulation paradigm are plausible, there may be a predictable obstacle before we can demonstrate an objective difference in N1-P2 cortical response between the normal control and tinnitus subjects. According to a recent study which compared the blink startle reflex between the normal control and tinnitus subjects, a significant difference was demonstrated but this finding was found not only in the high pitch background noise (similar to that of the tinnitus which the subjects perceived) but also in the low pitch background noise which was completely different form that of the tinnitus which the subjects perceived.10) The authors speculated that the difference between the two groups may merely be due to an impaired cortical processing in tinnitus patients.10) This might reflect that the gap deficit is not a specific finding in human tinnitus patients. But since the primary outcome measure is different (blink startle reflex vs. N1-P2 cortical response) between the study of Fournier and ours, a different result may also be possible. Based on our findings, we believe these parameters can also be applied to subjects with tinnitus with/without hearing loss. In our next study, which will compare the G/N ratio between the normal controls and tinnitus subjects, we hope to apply our system to tinnitus patient and are willing to see if the same problem is also found with the N1-P2 cortical response.
We have measured the N1-P2 cortical response to the prepulse gap stimuli. However, the original GPIAS for animals was based on the startle response. The startle response or startle reflex is the abrupt movement of the animal to a sudden unexpected acoustic stimulus. It can be measured though a piezoelectric sensor or an accelerometer attached to the animal restraining platform. The startle response has a longer neural pathway compared to the N1-P2 response, since the motor neural pathways are involved as well as the auditory sensory pathways. There seems to be a large difference in the startle response and N1-P2 cortical response in terms of activated neural networks. If we were to reproduce the exact same GPIAS system in human subjects, we should have measured the startle response as well. But it is difficult to measure the startle reflex in humans and the startle response in humans may be easily habituated with repeated stimulation. We have turned to the N1-P2 cortical response instead. The N1-P2 response is a well-known, reliable and reproducible auditory cortical response.11) There is a positive relationship between the intensity of the stimulus and the amplitude of the N1-P2 response. Based on these properties, we assumed that the N1-P2 cortical response may be an appropriate alternative to the startle response in humans. Through this study were able to find a similar pattern of inhibition in N1-P2 cortical response in the normal control. We believe, at least in humans, the cortical response is more reliable and objective than the startle response.
Conclusion
Through this study, we have found that the optimal stimulus should be composed of the 1 kHz pulse noise without Hanning window. The intensity of the background noise should be 20 dB HL and the location of the gap should be 20 msec prior to the pulse noise. It seems that with these optimized parameters we could expect a 78.0% inhibition of N1-P2 amplitude in normal subjects without tinnitus. Despite the limitation of small subject number, the results seem promising in terms of applying the prepulse gap paradigm to humans. The prepulse gap paradigm may also be applied to humans as a tool to detect tinnitus. We hope more research and development will follow.