Error Patterns Analysis of Hearing Aid and Cochlear Implant Users as a Function of Noise
Article information
Abstract
Background and Objectives
Not all impaired listeners may have the same speech perception ability although they will have similar pure-tone threshold and configuration. For this reason, the present study analyzes error patterns in the hearing-impaired compared to normal hearing (NH) listeners as a function of signal-to-noise ratio (SNR).
Subjects and Methods
Forty-four adults participated: 10 listeners with NH, 20 hearing aids (HA) users and 14 cochlear implants (CI) users. The Korean standardized monosyllables were presented as the stimuli in quiet and three different SNRs. Total error patterns were classified into types of substitution, omission, addition, fail, and no response, using stacked bar plots.
Results
Total error percent for the three groups significantly increased as the SNRs decreased. For error pattern analysis, the NH group showed substitution errors dominantly regardless of the SNRs compared to the other groups. Both the HA and CI groups had substitution errors that declined, while no response errors appeared as the SNRs increased. The CI group was characterized by lower substitution and higher fail errors than did the HA group. Substitutions of initial and final phonemes in the HA and CI groups were limited by place of articulation errors. However, the HA group had missed consonant place cues, such as formant transitions and stop consonant bursts, whereas the CI group usually had limited confusions of nasal consonants with low frequency characteristics. Interestingly, all three groups showed /k/ addition in the final phoneme, a trend that magnified as noise increased.
Conclusions
The HA and CI groups had their unique error patterns even though the aided thresholds of the two groups were similar. We expect that the results of this study will focus on high error patterns in auditory training of hearing-impaired listeners, resulting in reducing those errors and improving their speech perception ability.
Introduction
It is widely acknowledged that speech perception tests are used to evaluate the communicative ability of hearing impaired listeners, select hearing aid (HA) and/or cochlear implant (CI) candidacy, and plan appropriate aural rehabilitation for these listeners. The speech perception tests have considerable merit in that they are more similar to realistic life/world situations than measurements that simply use pure tone stimuli [1]. Thus, these speech perception tests can more accurately assess and reflect a listener's actual daily communication ability [2]. There are different kinds of speech perception tests for clinical use called speech audiometry: speech recognition threshold; speech recognition in quiet using materials like meaningful monosyllabic words, sentences, and nonsense syllable; and speech recognition in noise, defined as Speech Perception in Noise [3], the Hearing in Noise Test [4], and the Quick Speech in Noise Test [5]. In particular, the tests of speech recognition in quiet have been underestimated in terms of their value and usage since many clinicians have focused on average correct response (or correct percent) when evaluating the speech perception ability of their hearing impaired listeners [6]. Based on the average correct response, many researchers have provided documentation for the classification of hearing loss for more than four decades [2]. For example, normal hearing (NH) listeners and individuals with conductive hearing loss will have a score of 90% or better at the presentation of the most comfortable level (MCL), whereas listeners with sensorineural hearing loss will show much poor scores than those with conductive hearing loss while also showing a rollover effect if they have damaged retrocochlear region [2]. From a practical standpoint then, do such results offer enough information to determine the speech perception ability of hearing impaired listeners? Experienced clinicians rarely agree on the answer to this question. Previous research has shown that hearing impaired listeners will not have the same speech perception ability even though they may have the same pure tone threshold and configuration [78910]. In a series of studies by Han and Allen [8], No and Lee [9], hearing impaired subjects with symmetrical sensorineural hearing loss showed different consonant perception ability within and/or across multiple subjects. Baddeley [10] supported this statement in that the configuration of hearing loss had a limitation in terms of predicting speech perceptual errors. Under a simulation technique of HA amplification, 20 hearing impaired subjects with symmetrical pure-tone audibility did not receive the same benefit from both ears [7]. Thus, limited information provided by current average correct response did not include the specific features of speech perception in these hearing impaired listeners.
Nevertheless, 50% of scores for the sentence test is one of the crucial criteria for determining candidacy for cochlear implantation in a clinic. Although sentence stimuli in the speech perception tests are appropriate for validity sampling everyday conversational speech, their inherent redundancy and contextual cues make it difficult to determine clearly how much of each stimulus is actually perceived by the listener and how much displays the listener's ability to understand speech [1]. Also, unfamiliarity with the sentence materials can reduce the chance of performance because that circumstance affects the working memory in terms of repeating the stimuli correctly after only very few presentations of the stimuli [11]. For this reason, it is not sufficient for both clinicians and patients to assume that 40% scores on a sentence test are poorer than a 60% correct response and thus make the patient eligible for an implant. On the other hand, meaningful monosyllabic word tests are most commonly used, as they are the most convenient and the fastest and easiest to use to calculate the scores among the battery of speech perception tests. However, Mendel and Danhauer [1] criticized any speech test using meaning monosyllabic words due to a lack of both diagnostic sensitivity and face validity for predicting social adequacy and the limitation in terms of differentiating the actual degree of hearing loss. As an analytic approach, hence, some researchers have claimed the advantages of phoneme and feature recognition in an effort to better understand speech perception even though the average word recognition score is still the traditional method for appraising supra-threshold speech perception ability in hearing impaired listeners [12]. In 1986, Donaldson and Kreft [13] explained that to measure speech perception ability using feature recognition could calculate the perceptual scores of vowel and consonant separately, and analyze their errors, resulting in finding individual error patterns for applying aural rehabilitation. Gordon-Salant [14] also conducted consonant confusion testing of 20 CI users using 19 consonants and 3 vowels. Their results showed that the average correct percent of consonant recognition differed in terms of the kind and place of the combined vowels. However, most of the research has still not considered how similar or different the error patterns are, but rather focused on how many incorrect responses (or averaged scores) a hearing impaired patient will make.
We need to change the viewpoint on such scores. If clinicians focus on incorrect responses instead of the correct responses and then analyze the error pattern of the incorrect response, the specific characteristics of the hearing impaired population will be profiled [15]. Baddeley [10] argued that overall correct percent did vary and error patterns for the incorrect answers differed according to the degree of hearing loss. If the speech perception ability of hearing impaired listeners is evaluated using error analysis, we will be able to anticipate the success of HAs and/or CIs and gain a scientific and evidence-based clue for their fitting or mapping methods. For instance, a hearing impaired listener has regular error patterns, and so it is possible to examine whether the error patterns are caused by a cochlear dead region that cannot be solved by current amplification tool or caused by a distortion of acoustic cues after wearing amplification that can be modified by new fitting and/or a mapping algorism. Such a viewpoint can offer a much more scientific and descriptive profile of the hearing impaired listener's phonemic errors when perceiving speech sounds and result in improvement of impaired perceptual ability. In addition, the error patterns of the incorrect responses in these speech perception tests will let us observe the original error patterns in the assistive listening devices, e.g., HAs versus CIs, and provide greater knowledge of the different characteristics in speech perception of these populations.
In short, the purpose of the present study is to scrutinize error patterns in hearing-impaired listeners, i.e., HA and CI users, and NH listeners as a basic comparison, while applying various signal-to-noise ratios (SNRs) instead of only the traditional approach.
Subjects and Methods
Subjects
Thirty-four hearing impaired adults participated in this study. Of them, 20 have worn HAs, and 14 have used CIs. All were outpatients at the Soree Ear Clinic and visiting for a clinical follow-up. The age mean in the HA and CI groups was 52.5 years (SD: 14.90) and 44.5 years (SD: 15.46), respectively. Etiologies of the individual subjects varied, but they all had symmetrical bilateral sensorineural hearing loss. Seventeen out of 20 HA users and three CI users were bilaterally wearing the device. The duration of auditory deprivation was 13.32 years (SD: 11.64) in the HA group and 17.77 years (SD: 13.87) in the CI group. Experience with HA and CI was 5.19 years (SD: 5.07) and 2.51 years (SD: 0.36), respectively, in those groups. A control group consisting of 10 NH adults was also recruited to demonstrate the difference in performance for the hearing impaired groups. These individuals ranged in age from 21 to 24 (mean: 22.7 years, SD: 1.16). In short, a total of 44 (21 males and 23 females) were tested for the error pattern analysis. All subjects were native Korean speakers and completed the informed consent form before the experiment.
Unaided and aided thresholds
In the unaided condition, the NH, HA, and CI groups demonstrated 11.25±2.84 dB HL (within NH range), 58±5.23 dB HL (moderate-to-severe hearing loss), and 107.5±1.88 dB HL (profound hearing loss), respectively, showing a symmetric gradual high-frequency hearing loss- at a 4-tone average of hearing threshold at 0.5, 1, 2, and 4 kHz. Aided thresholds for the HA and CI groups were 46±8.32 dB HL and 37±4.84 dB HL, respectively. Compared to the aided threshold for HA users, CI users showed 10-30 dB better detection in high frequency regions, as expected. However, MCL of three groups were not much difference bilaterally, indicating 45±0.0, 51.5±3.67, and 50.14±2.26 dB HL for NH, HA, and CI, respectively, in the aided condition.
Procedure
Before the experiment, all subjects were checked for normal middle-ear status in an otoscopy examination and were confirmed to have a type-A tympanogram (Madsen Zordiac 901, GN Otometrics, Denmark). They also were tested for pure-tone audiometry by air and bone conductions from 250 to 8000 Hz (GSI TympStar v2; Grason-Stadler, Eden Prairie, MN, USA) using a headphone for the unaided condition and a speaker for the aided condition. As stimuli, the Korean monosyllabic test, Korean standard monosyllable word lists for adults [16] consisted of 50 words per a list. It was produced by one male talker on a compact disc player. The stimuli were presented binaurally in quiet and at three different SNRs (i.e., +6, 0, -6 dB) with white noise through a speaker (0° degree) in a sound isolation chamber. The presentation level of the syllables was set to each subject's MCL initially, and then adjusted so that the monosyllables were equally loud independent of SNRs. For an easy listening condition, the quiet condition was tested first and then +6, 0, -6 dB SNRs were followed. Four lists of the speech test were randomized across the subjects. When the subject listened to each monosyllable, he/she produced it with accuracy. While recording these responses, two testers wrote down errors in accuracy if patients responded incorrectly and compared the errors to determine the final answers.
Data analysis
Error percent and error patterns were separately analyzed as a function of SNRs, depending on the groups. For a comparison of the average error percent in the three groups, a two-way (3 groups×4 SNRs) repeated-measures analysis of variance (ANOVA) was used to evaluate the data. If necessary, a Bonferroni correction was used as post-hoc test. The criterion used for statistical significance was p<0.05 in this study. Statistical analysis was performed using SPSS software (ver.20; IMB Co., Armonk, NY, USA).
The error patterns of the recorded incorrect answers were analyzed by two audiologists and classified into seven types, namely, substitution, addition, omission, substitution plus omission, substitution plus addition, fail (or 100% incorrect), and no response, using stacked bar plots for each SNR. In a definition of these error types, 'substitution' represented replacing one among the initial, medial, or final ones with another phoneme, instead of the target one. The 'addition' referred to adding a new phoneme indicating that /ja/ was replaced to /jam/, for example. The 'omission' referred to missing the phoneme. In general, addition and omission happened in the final phoneme. A combination of 'substitution plus omission' or 'substitution plus addition' meant that one of three phonemes was replaced by another, and one of the remaining two phonemes was omitted or added. For example, /gul/ was responded to /gui/, resulting from /u/ being replaced by /ui/ and /l/ being left out. The failure referred to respond 100% to incorrect answer, where all initial, medial, and final phonemes were wrong. 'No response' was considered 'no answer' during the response time.
Results
Total error percent as a function of SNR
Fig. 1 shows the bar graphs for the mean of error percent in three groups as a function of SNR, including error bars for the standard deviant. Overall, the mean error percent of the three groups was increased, as the SNRs decreased, as we expected. In the quiet condition, the mean error percents were 2.20, 28.40, and 54.14 (SD: 4.15, 2.93, and 3.51) for the NH, HA, and CI groups, respectively. At +6 dB SNR, the mean error percents were 9.80, 48.80, and 67.14 (SD: 5.11, 3.61, and 4.32) for the NH, HA, and CI groups, respectively. At 0 dB SNR, the mean error percents were 17.20, 73.30, and 79.00 (SD: 5.19, 3.67, and 4.39) for the NH, HA, and CI groups, respectively. At -6 dB SNR, the mean error percents were 46.00, 96.50, and 98.00 (SD: 1.83, 1.30, and 1.55) for the NH, HA, and CI groups, respectively. The error percent for the NH group did not reach 50% in all SNRs, whereas that for the CI group was as high as 54% even in the quiet condition. Although the performance of the HA group was much better than that of the CI group at quiet and +6 dB SNR, there was no performance difference between the two groups at the lower SNRs. Interestingly, the standard deviation was higher at the quiet, +6, and 0 dB SNR than at the -6 dB SNR condition in both hearing impaired groups. This variance of standard deviation indicated a large individual difference in the low SNRs. The -6 dB SNR was too large an amount of background noise to differentiate the speech perception ability of the hearing impaired groups.
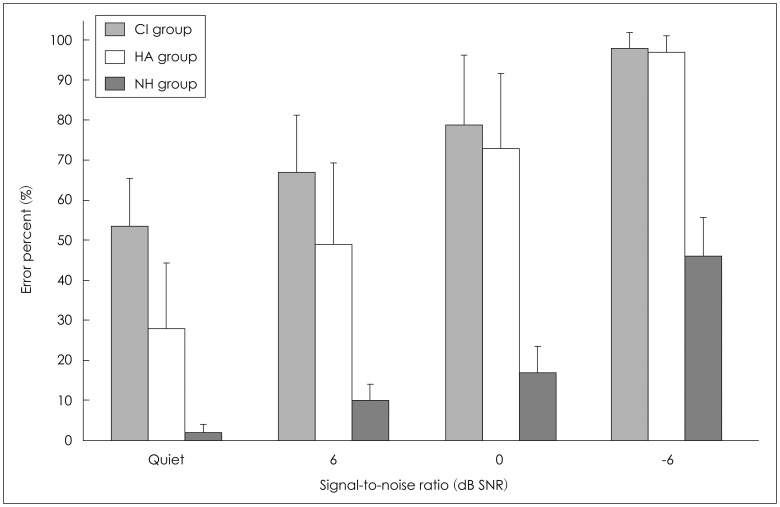
Average error percents for the three groups. CI: cochlear implant, HA: hearing aid, NH: normal hearing.
The two-way repeated ANOVA confirmed a significant main effect of SNRs [F(3, 123)=199.425, p<0.001]. The mean of error percent for the quiet condition was significantly higher than that for +6 dB SNR, while +6 dB SNR was higher than 0 dB SNR, and 0 dB SNR was higher than -6 dB SNR (Bonferroni multiple-comparison post hoc test, p<0.001). Overall performance for the three groups was significantly different [F(2, 41)=88.954, p<0.001]. The CI group yielded the worst performance, followed by the HA group and then the NH group (Bonferroni test, p<0.001). Also there was an interaction between SNRs and the groups [F(6, 123)=8.295, p<0.001]. The mean difference of error percent attributable to the quiet condition was 28.40%, showing approximately at the midpoint between the error percents for the CI and NH groups. However, the mean of error percents for the HA group was slight lower than and similar to that for the CI group at 0, and -6 dB SNR, respectively.
Analysis of error pattern as a function of SNR
For the error pattern analysis, the total error percent for each condition, recalculated to be maximized, produced 100%. First of all, the NH group showed a dominant substitution error, regardless of the SNRs compared to the two hearing impaired groups. In the quiet condition, there were only two error patterns: 81.82% for substitution and 18.18% for addition. At +6 and 0 dB SNR, the substitution error was also mostly dominant by 73.47% and 76.47%, respectively and there were five error patterns' showing a very similar proportion in both conditions. Although it was a small portion, the substitution plus omission error at +6 dB SNR changed to the pattern of substitution plus addition. At -6 dB SNR, all seven error patterns appeared, while the percent of substitution error decreased to 59.13%, and 9.13% of the remaining patterns accounted for the no response error (Fig. 2).
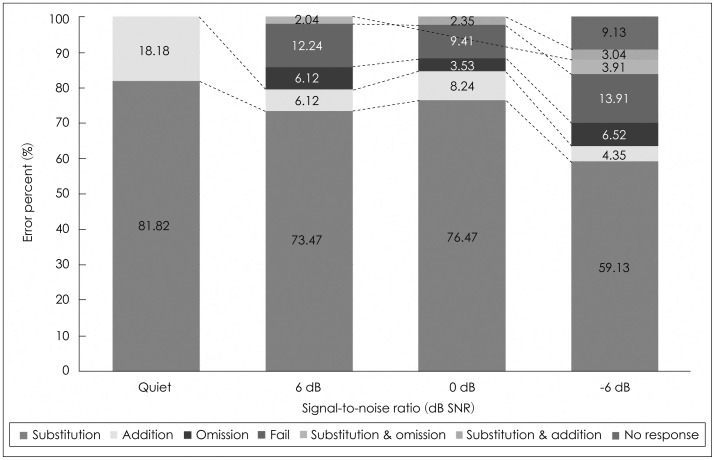
Error pattern analysis of the normal hearing group.
As shown in Fig. 3, in the group of HA users, all seven error patterns existed even in the quiet condition although the substitution was dominant at 68.97%. The second common error pattern was the fail at 14.83%. However, as noise increased, the substitution error dramatically dropped from 68.97% to 4.77%, at quiet and -6 dB SNR, respectively. Contrary to this result, the no-response error increased from 4.48% in the quiet condition to 90.92% at -6 dB SNR, which meant that the six error patterns except for the no response error accounted for less than 10%. The proportion of the fail error did not much change from quiet to 0 dB SNR, i.e., 14.83% for quiet, 16.38% for +6 dB SNR, and 14.04% for 0 dB SNR, but only 2.33% at -6 dB SNR.
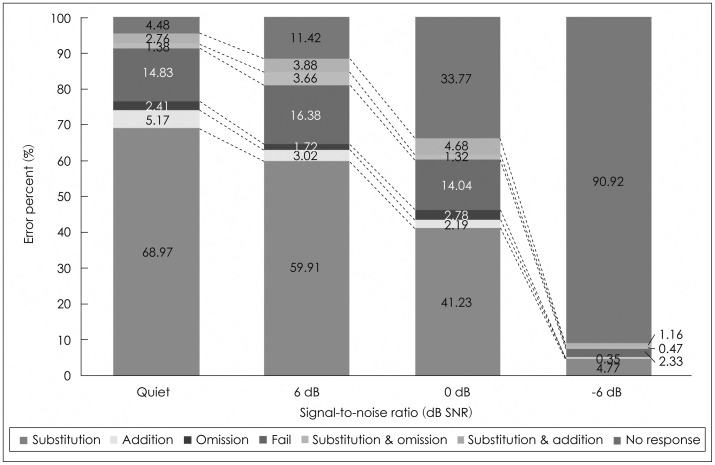
Error pattern analysis for the hearing aid group.
Like the HA group, the group of CI users also showed that substitution errors declined and no response errors dramatically increased, as SNRs increased (Fig. 4). Interestingly, the CI group characterized lower substitution and higher fail and no response errors than the HA group. The fail error was noticeable at both +6 and 0 dB SNR, at 24.23% and 23.23%, respectively. At -6 dB SNR, addition, omission, and the substitution plus omission errors disappeared, while the no response error was occupied at 93.92%. Eventually, the CI group had four error patterns, no response (93.92%), fail (3.94%), substitution (1.64%), and substitution plus addition (0.33%), at -6 dB SNR.
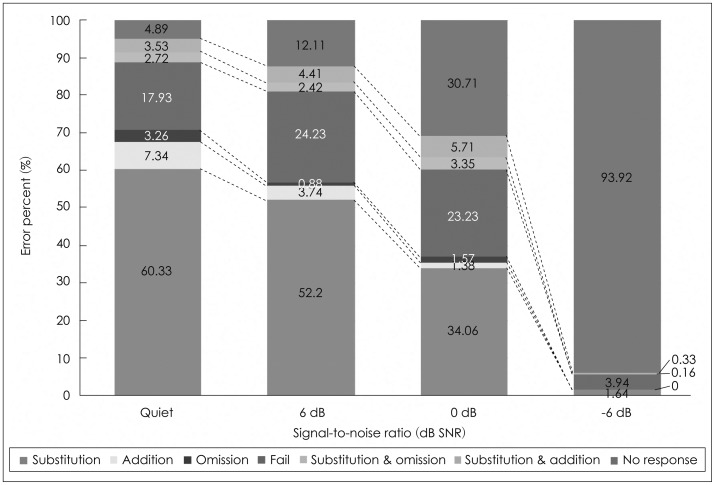
Error pattern analysis for the cochlear implant group.
Table 1,2,3,4 indicate kind of error patterns and the occurred number of each pattern, ranging from high to low frequency order for the three groups as a function of SNR: Table 1 for quiet, Table 2 for +6 dB SNR, Table 3 for 0 dB SNR, and Table 4 for -6 dB SNR. As shown in Table 1, the two hearing impaired groups characterized their unique initial substitution, when compared to the NH group which had a few sporadic errors in the quiet condition. The HA group showed clustered confusions of phonemes from neighbor frequencies. For example, the /t/ phoneme with high frequency energy was mostly confused with the /p/ phoneme with mid-frequency energy. The /n/ and /ŋ/ phonemes having an energy of mid-frequency were confused with the sounds of low frequency, /m/. Although the HA group had substitution for several sounds with low frequency characteristics, the CI group made remarkable error patterns only within the low frequency regions, /m, n, ŋ/ at each other. For the medial phonemes, usually vowels, the three groups had similar substitution errors, showing that /ʌ/ changed to /ɑ/ and /o/ changed to /u/. Interestingly, the final phonemes were confused within only those phonemes of low frequencies in both the HA and the CI groups. Addition and omission errors occurred in the final phoneme only, distinguishing the addition of the /k/ phoneme in all three groups.
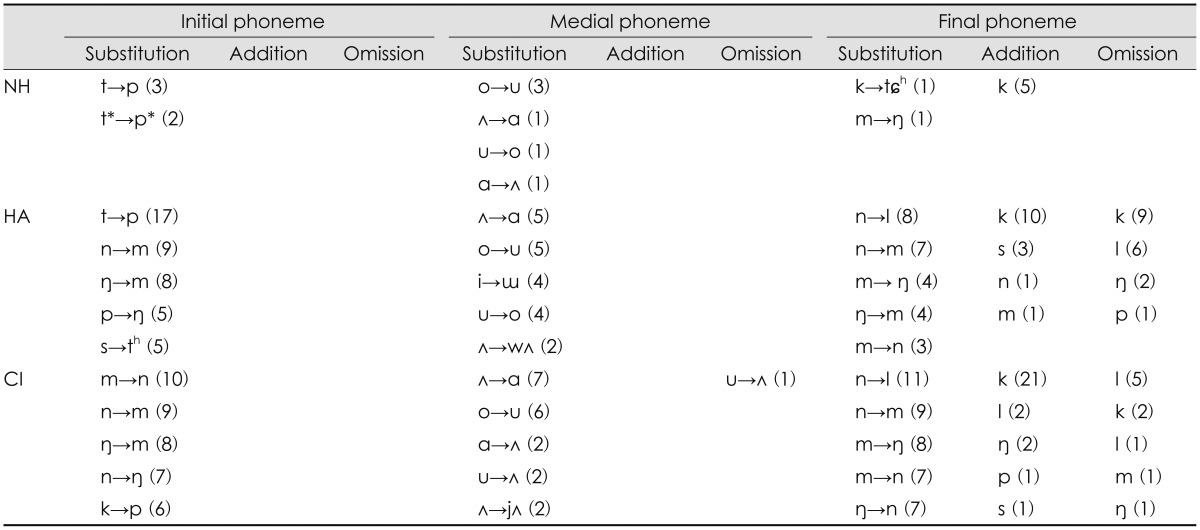
Comparison of error patterns for the NH, HA, and CI groups in the quiet condition
Comparison of error patterns for the NH, HA, and CI groups at +6 dB SNR

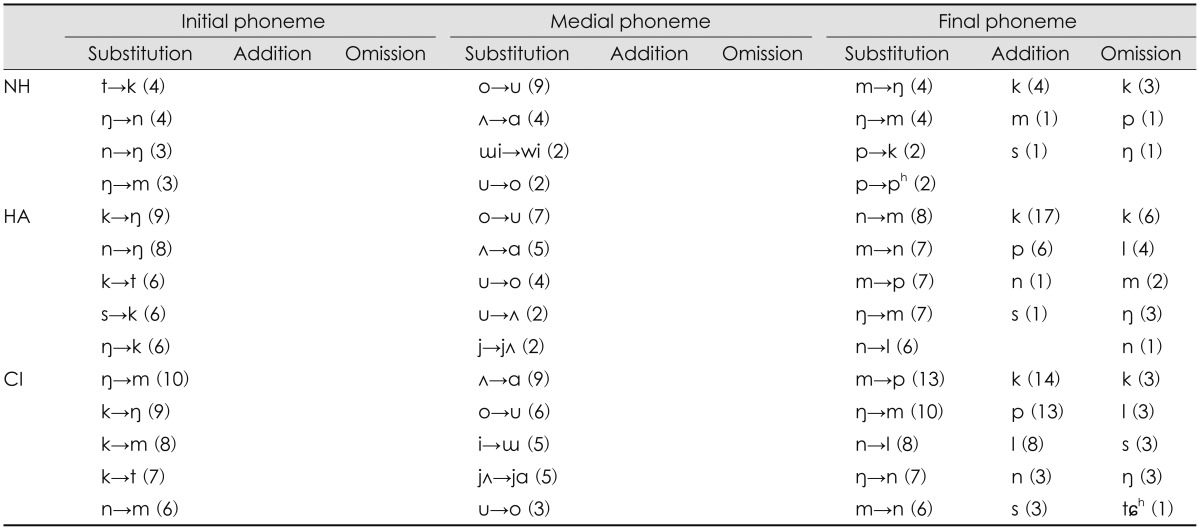
Comparison of error patterns for the NH, HA, and CI groups at 0 dB SNR
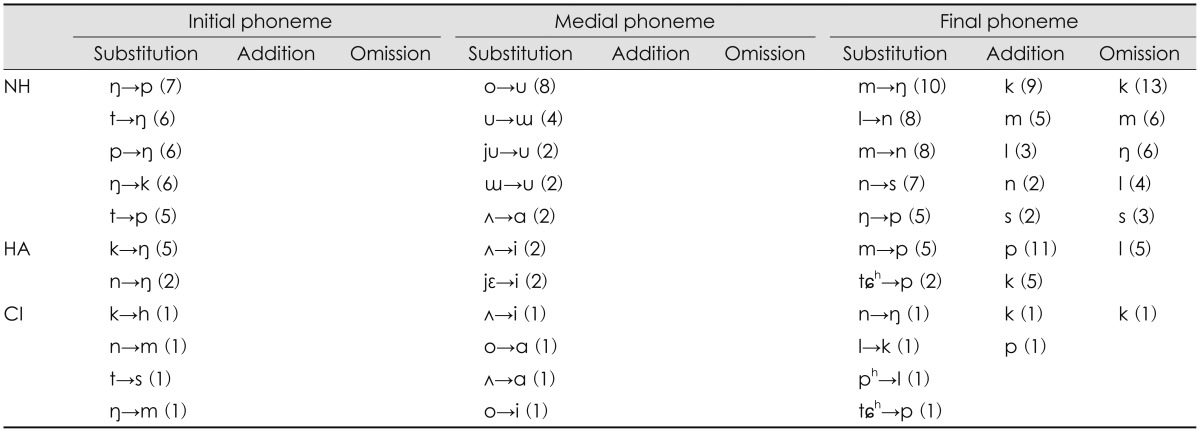
Comparison of error patterns for the NH, HA, and CI groups at -6 dB SNR
At +6 dB SNR, the initial phoneme of the NH group showed three substitution errors, /ŋ, n, m/ for each other, limited within low frequencies except for the /t/ phoneme, which changed into /k/ (Table 2). Both the HA and CI groups missed the /k/ phoneme out which had mid-frequency characteristics, yet the pattern differed. The HA group substituted the /k/ phoneme with phonemes of low or high frequency and vice versa, whereas the CI group substituted the /k/ phoneme to phonemes of only low frequencies, in mostly /m/. Substitution errors of the medial phoneme were same as the patterns in the quiet condition for two hearing impaired groups, resulting in /ʌ/ changing to /ɑ/ and /o/ changing to /u/. In the final phoneme, the HA and CI groups still had limited error patterns across the low frequency regions, except for the /p/ phoneme having characteristics of mid-frequency changing from the /m/ phoneme having a low frequency. The /k/ phoneme was the most common in either the addition or omission error of the final phoneme in all three groups.
As noise increased to 0 dB SNR, the NH group had three substitution errors at the initial phoneme: /n/ to /m/, /t/ to /k/, and /t/ to /p/ (Table 3). In the HA group, substitution error at the initial phoneme was the /s/ phoneme having high frequency characteristics mostly perceived as the /h/ phoneme at mid-frequency. Secondly, the initial phoneme, /ŋ/ with midfrequency characteristics, substituted for the /m/ phoneme of mid-frequency. The initial phonemes, /k, p/ substituted for /ŋ/ in the HA group. Unlike the HA group, the 0 dB SNR condition was more difficult for the CI group in terms of the error pattern at initial phonemes. Regardless of the frequency characteristics of the phoneme, /k, n, p/ were not clear enough to understand, resulting in substitution for only the /ŋ/ phoneme. In the medial phoneme, pairs of /ʌ/ vs. /ɑ/, /o/ vs. /u/ still were a remarkable substitution, except for /ɯ/ which changed to /i/ in the HA group. For the final phoneme, both the HA and CI groups showed that the /m/ phoneme having a low frequency characteristic substituted for the /p/ phoneme with middle frequency distribution. In addition, there was an addition error of the /p/ phoneme at the final phoneme in only the CI group. However, both the NH and HA groups still had an exceptional addition error of the /k/ phoneme.
As shown in Table 4, both HA and CI groups showed greater number of errors and yet few unsystematic patterns although the NH group had a notable substitution of initial and final phonemes at -6 dB SNR. In particular, the HA group understood initial /k, n/ phonemes as /ŋ/. The NH group had substitution errors across sounds of only low frequency characteristics and showed the /k/ addition and omission in the final phoneme, a similar pattern to the HA group at quiet and +6 dB SNR.
Discussion
Many hearing-impaired listeners complain that speech can be heard but not understood when they listen to it [6]. As one of the reasons, Dobie and Sakai [17] examined the common limitation of current clinical tests and found that pure tone audiogram and word recognition scores highly correlate, but there is a question as to whether these two predictor variables each can explain the variance in self-reporting on hearing impaired listeners' satisfaction with speech perception. Dobie and Sakai [17] also discovered a low correlation between current speech tests and the benefit of HAs, which means that HA fitting based on the results of current clinical tests can partially compensate for hearing sensitivity, but not for speech loss [6]. Their results were supported by a longitudinal study by Bentler, et al. [18]. Thus, it appears that fitting the HA or mapping the CIs based on current clinical tests will have some limitations in terms of improvement of speech understanding. As a result, the research field of speech perception as it relates to clinical audiology has developed further, but the diagnostic speech tests used in the clinic environment remain still very limited and are less helpful to hearing impaired patients due to their discrepancies [6]. In addition, it is still unclear how the impaired listeners' auditory system decodes speech because of their heterogeneous characteristics and possible auditory neuropathy even after wearing assistive listening devices. For this reason, the current purposed study analyze error patterns of speech perception for the hearing-impaired, especially HA versus CI users as a function of SNRs, using NH listeners as the control.
The results of the current study show that hearing impaired groups have dramatically increased errors as noise increases, as expected from the results of the many previous studies. Compared to the HA group, the CI group with a better aided threshold at high frequencies had a higher mean of error percent. This basic finding was observed in a previous study [19]. It can be related to several factors. The CI group had a little longer duration of auditory deprivation, a poorer unaided threshold, and a little shorter experience wearing their devices than did the HA group. In addition, since mid-frequency audibility, which was not much different between two groups, is important in order to perceive the fricative cue [20], that their similar audibility of mid-frequency might affect the mean scores. As many researchers have already mentioned, the individual ability of hearing impaired speech perception varies within each group. In particular, as noise increases, there is a large individual difference in the mean error percent in the NH group, but only a small individual difference in both the HA and CI groups [14]. Freyman and Nerbonne [21] added that audibility has a limitation in terms of explaining consonant perception scores and errors, and thus frequency information by amplitude envelope of speech is more effective. Although listeners can have similar hearing loss, aided threshold, and average speech perception ability, they can also have a different error pattern [10]. Thus, clinicians need to see the regular error pattern and apply it when they plan for individual aural rehabilitation.
In general, our analysis of the error pattern found that the NH group showed dominant substitution, regardless of SNRs, and both the HA and CI groups showed that substitution errors decline and no response errors appear as SNRs increase. The CI group characterized lower substitution and higher fail errors than did the HA group. However, a previous effort from Lee and Kim [19] explained that the CI group showed a fail error (58%), substitution error of final (13%) and initial consonants (9%), whereas the HI group demonstrated that no response error was the most common at 44%, and fail (33%) and substitution of initial consonant (9%) followed. As one of the possibilities for these contradictory findings, we might explain that their study was conducted in only a quiet condition and included a small number of subjects (9 for CI and 8 for HA). Nevertheless, both our and their data proved the substitution was the most frequent error pattern in common. In particular, the present data shows that substitutions of initial and final phonemes in the HA and CI groups were limited by place of articulation errors. That is, the hearing impaired listeners missed spectral cues, which were indeed well established by Gordon-Salant [14] in that spectral cues were the most poorly transmitted cues in the feature analysis. However, as unique error patterns of each group, our HA group missed consonant place cues, such as formant transitions and stop consonant bursts in /t, p/, whereas the CI group usually had limited confusions across nasal consonants with low frequency characteristics in either the initial or final phoneme. As noise increased, the CI group missed the burst of /k/ phonemes, resulting in being perceived as /ŋ/, which means they missed the spectral cue of an initial consonant [22]. These findings were also not same as previous study by Lee and Kim [19] which concluded that the most common substitution phonemes in both the HA and CI groups were /n/ vs. /m/, /m/ vs. /l/. It should be noted as well that Lee and Kim used the hearing-impaired listeners who have longer duration of hearing loss and poorer aided threshold in their study compared to our data, so it is not clear whether there were perceptual effects of changes to a HA or CI user's condition of fitting or mapping [14]. Vowel perception of the medial phoneme did not differ across the three groups, showing that /ʌ/ confused to /ɑ/ and /o/ confused to /u/. Four confused vowels were articulated in the back, but the height of the tongue differs although there is effect of vowel context on the preceding consonant information [23]. Thus, although vowel perception is not sensitive to noise [24], it is important that an additional visual cue is provided for hearing-impaired listeners [25]. Interestingly, all three groups showed /k/ addition in the final phoneme, and that trend was magnified as noise increased. This finding was supported by recent study of Kim, et al. [26] in which 30 HA users participated. We assume there is likely a difficulty in perceiving short-duration and transient spectral cue under the noise condition. This possibility could be evaluated through further detailed analyses of speech error patterns in future research.
The classical findings show that there was surprising similarity in the phoneme and feature recognition ability of most hearing-impaired listeners, regardless of the nature and extent of their hearing loss. While the probability of making recognition errors is certainly greater in the more severe hearing impaired, the phonemes and features actually confused seem to be remarkably similar, regardless of the nature and extent of the hearing impairment [12]. However, we disagree with that statement since the damaged auditory system in hearing-impaired listeners differs in terms of neural plasticity after wearing assistive listening devices (i.e., HAs and/or CIs). Neural plasticity, one of the inherent characteristics of the central nervous system, defines the changing pattern associated with neural form and its connection-based behavioral and learning experience throughout life. In humans, dysfunction of the auditory system is altered in and of itself or via auditory input through assistive listening devices, such as HAs and CIs as time passes. In future research, in terms of the view of neuroplasticity, we need to analyze improvement of speech perception in a longitudinal study. It is well known that the speech perception ability of HAs and/or CI users is better than that of hearing-impaired listeners who do not wear these assistive listening devices. Early intervention and a long trial period are key actions for speech perception ability. The auditory pathway system is still impaired, but ability of the brain can change for the better (i.e., error to correct perception) or not (i.e., error to another error). There is a limitation of the current study that warrants further research in terms of lexical effect on error categorization [27]. The meaningful monosyllable words which we used could provide top-down perceptual effect to the listeners resulting in any possible biased pattern although we intended to see the error patterns of hearing-impaired listeners under more realistic listening situation. Despite of such a limitation, the results of the current study have a possible implication for focusing on high error patterns in auditory training of either HA or CI groups, and thus help reduce those errors and improve speech perception ability for the groups.
Conclusion
The HA and CI groups had their unique error patterns even though the aided thresholds of the two groups were similar. HA and CI groups showed that substitution errors decline and no response errors appear as SNRs increase. The CI group characterized lower substitution and higher fail errors than did the HA group. We expect that the results of this study will focus on high error patterns in auditory training of hearingimpaired listeners, resulting in reducing those errors and improving their speech perception ability.
Acknowledgments
Preliminary data of this work was presented at the American Academy of Audiology, Audiology Now 2014 (Orlando, FL, USA) in 2014.