 |
 |
- Search
| J Audiol Otol > Volume 19(2); 2015 > Article |
|
Abstract
Background and Objectives
The purpose of this study was to identify differences between the dynamic ranges (DRs) of male and female speakers using Korean standard sentence material. Consideration was especially given to effects within the predefined segmentalized frequency-bands.
Materials and Methods
We used Korean standard sentence lists for adults as stimuli. Each sentence was normalized to a root-mean-square of 65 dB sound pressure level. The sentences were then modified to ensure there were no pauses, and the modified sentences were passed through a filter bank in order to perform the frequency analysis. Finally, the DR was quantified using a histogram that showed the cumulative envelope distribution levels of the speech in each frequency band.
Results
In DRs that were averaged across all frequency bands, there were no significant differences between the male and the female speakers. However, when considering effects within the predefined frequency bands, there were significant differences in several frequency bands between the DRs of male speech and those of female speech.
Conclusions
This study shows that the DR of speech for the male speaker differed from the female speaker in nine frequency bands among 21 frequency bands. These observed differences suggest that a standardized DR of male speech in the band-audibility function of the speech intelligibility index may differ from that of female speech derived in the same way. Further studies are required to derive standardized DRs for Korean speakers.
The level distribution, or dynamic range (DR), of speech refers to the difference between the minimum and peak levels of speech. The DR has been used to determine amplitude compression processing for hearing aids and the band-audibility function of the speech intelligibility index (SII), which predicts the speech intelligibility performance [12345]. The bandaudibility function of the SII denotes the proportion of audible speech energy that is above the listener's hearing threshold in a given frequency band [5]. In other words, the function informs us of those audible speech ranges that contribute to intelligibility. This proportion may be affected by the DR of speech within the band-audibility function. For example, if the entire speech DR is 40 dB, and an individual listener's threshold is 20 dB above the minimum volume of the entire speech DR, then 50% of the speech is audible within that frequency band. Thus, the DR of speech may have an important role in the band-audibility function of the SII.
In English intelligibility models like the SII, the DR of speech is assumed to be approximately linear over a 30 dB range across all frequency bands [456]. Speech peaks are calculated using long-term root-mean-square (RMS) speech spectrum values above 15 dB, and speech minima are calculated using long-term RMS speech spectrum values below 15 dB [7]. Thus, the 30 dB DR is the difference between the peak speech level and the minimum speech level at a given frequency.
Recently, the DRs of recorded sentence-level materials spoken by both a Korean and an English male speaker were calculated and compared [8]. The study revealed differences between Korean and English speech with regard to frequency-band effects. Specifically, the DRs in Korean were smaller than the DRs in English at both low-frequency bands [less than the center frequency (CF) of 455 Hz] and high-frequency bands (above the CF of 4050 Hz). On the other hand, the DR in Korean was greater than the DR in English at mid-frequency bands (between the CF of 455 Hz and 4050 Hz). However, only male speech was recorded in the study.
In general, the acoustic features of male speech differ from those of female speech. For instance, it has been reported that the glottal characteristics and fundamental frequencies (F0s) of vowels found in male speech differ from those found in female speech [910]. As an another example, Byrne, et al. [11] compared the long-term average speech spectrum (LTASS) of male speakers with that of female speakers in 12 languages. They found that, while the spectra were similar within the frequency range [250 to 5000 Hz (one-third octave)], there were different LTASS characteristics in the frequency ranges less than 250 Hz and above 5000 Hz. Specifically, male speech levels were higher than female speech levels at low frequencies (<250 Hz). This was true across all of the languages studied. Conversely, in several languages, notably Danish, the speech levels of female speakers at frequencies above 5000 Hz were much higher than those of male speakers at comparable frequencies.
The studies mentioned above demonstrate that the acoustic characteristics of male speech differ from those of female speech within specific frequency ranges. However, we cannot conclude from this that the DRs are also different, because it does not seem to be any direct link between these differing acoustic characteristics and the DR. Thus, it is necessary to measure the DRs of both the male and female speakers in order to identify whether the DRs are similar or different between the gender. In the English SII, the DR has been assumed to be approximately 30 dB for both genders. However, the 30-dB range was determined through a standardization process from measured DRs that were varied across male and female speakers [5]. Measuring the DR in Korean male and female speakers will inform us as to whether or not gender effects should be considered when deriving the standardized DR for Korean speakers.
Thus, the purpose of this study was to identify whether and how the DR of recorded Korean-language male speech differs from that of recorded Korean-language female speech. We used segmentalized frequency bands and standardized sentence material. The study provides more accurate information regarding the DR of Korean speech in male and female speakers. If the DR of female speech is similar to that of male speech across all frequency bands, then gender effects will be not a significant factor when deriving a standardized DR for Korean speakers. However, if the DRs across all frequencies do differ, even partially, then the differences will need to be considered.
The Korean Standard Sentence Lists for Adults (KS-SL-A), recorded by one male and one female speakers, were used as stimuli [12]. These consist of eight lists, each composed of 10 sentences. The same sentence lists were used for both genders.
We evaluated the DRs of the KS-SL-A readings by a male and a female speakers using the following procedure:
1) Each sentence was modified to ensure there were no pauses, and then digitized at a 44.1 kHz sampling rate using Adobe Audition (version 3.0; Adobe Systems Inc., San Jose, CA, USA). Because silent pauses longer than 200 ms are isolated from the speech, a threshold for silent pauses was set at 250 ms [13].
2) MATLAB (version R2013b; MathWorks Inc., Natick, MA, USA) was used to calculate the cumulative histogram levels. After the average RMS value was calculated, the level of each sentence set was normalized to an average of 65 dB sound pressure level (SPL).
3) The signal envelope was calculated in each of 21 critical bands, which had CFs ranging from 150 to 8600 Hz. These frequency bands were chosen using the SII critical band procedure, which specifies 21 critical-band divisions and steep filtering to remove the influence of filter slopes [5].
4) The envelope was smoothed using a raised cosine window specified by segment size in milliseconds.
5) The smoothed envelopes were subsampled at a rate of twice the inverse of the window length (i.e., equivalent to windowed segments having a 50% overlap), and the samples were converted to dB SPL.
6) The cumulative envelope distribution levels were then derived from the dB envelope histogram.
7) The DRs in each frequency band were averaged for each speaker.
In this study, the cumulative level histogram was used to determine the DR. The cumulative level histogram shows the cumulative envelope distribution levels of speech within the frequency bands. For example, the 99% cumulative histogram level (L99) indicates that 99% of the measured speech signals are at or below the peak level. The 1% cumulative histogram level (L01) indicates that 1% of the measured speech signals are at or above the minimum level. Thus, the DR between the level of 99% and 1% (L99-L01) can be obtained by subtracting the cumulative histogram level at L01 from that at L99. The integration time was 125 ms.
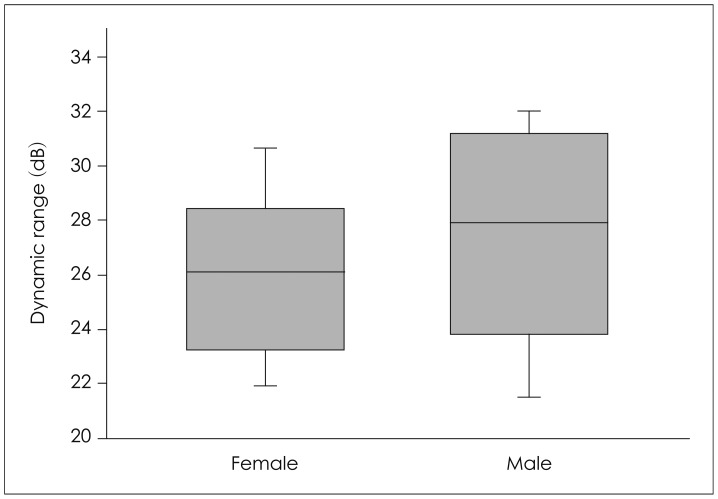
The measured DRs in the different speakers are shown in Fig. 1. When the DRs were averaged across all frequency bands, the DR of female speech was 26.17 dB while that of male speech was 27.6 dB. This did not constitute a significant difference (p>0.05).
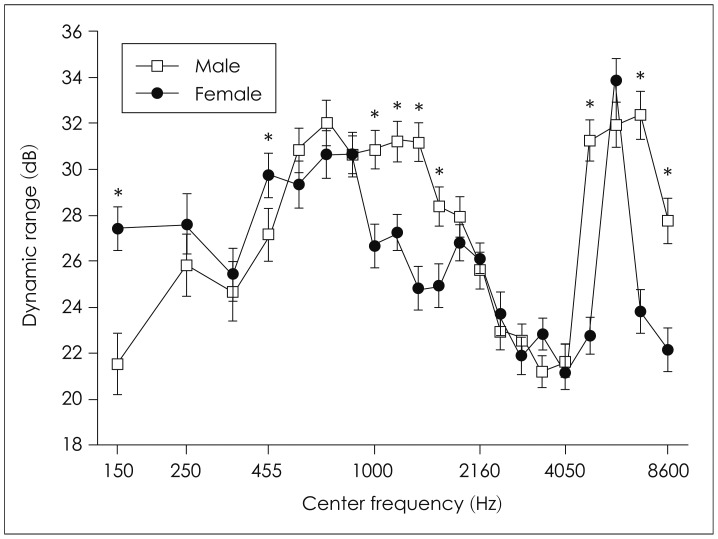
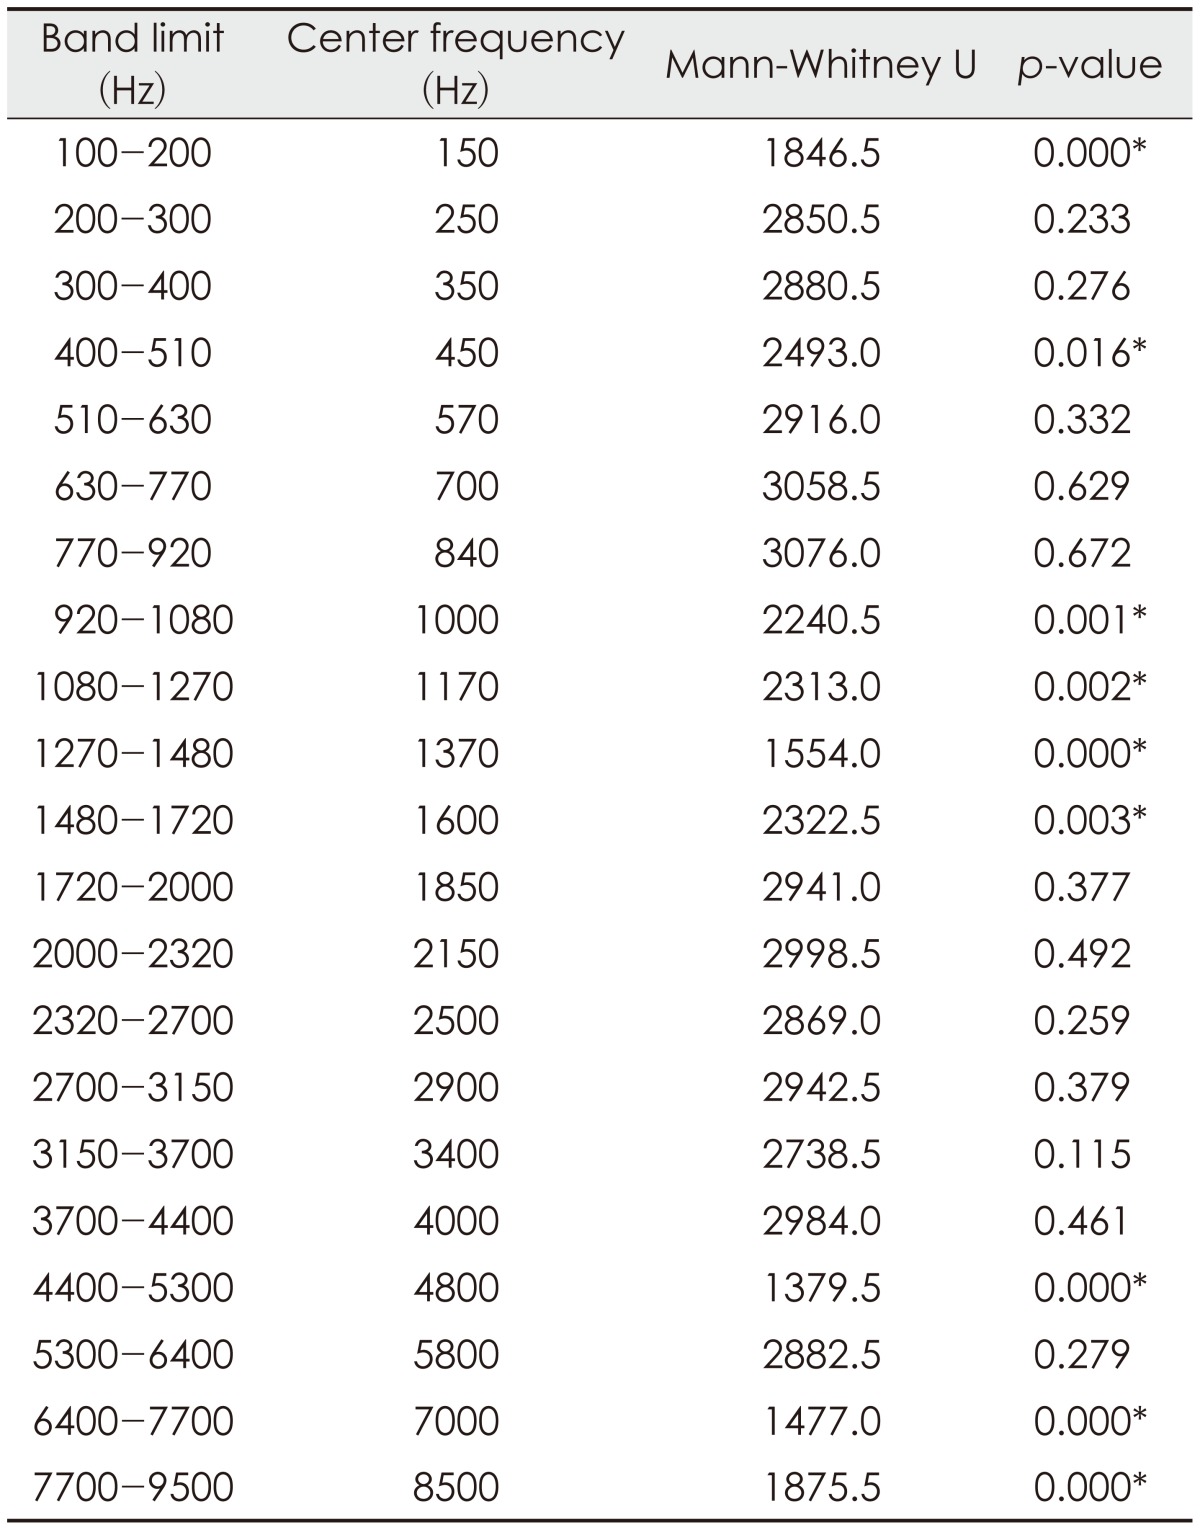
The DRs of male speech did differ slightly from those of female speech when the frequency-band effects were considered (Fig. 2, Table 1). The DR of female speech was at its lowest in the band of CF 4050 Hz, wherein the value was 21.16 dB. The highest DR in the female speech occurred in the band of CF 5800 Hz, wherein the figure was 33.87 dB. In the male speech, DRs were between 21.21 dB, in the band of CF of 3425 Hz, and 32.35 dB, in the CF of 7050 Hz. Specifically, the DRs of the male speech in nine frequency bands differed from those of female speech in the same bands (p<0.05). The DRs of female speech were broader than those of male speech in the low-frequency bands (CF<455 Hz). For example, the DR of female speech in the frequency band of 150 Hz (CF) was 5.89 dB greater than the DR of male speech in the same band. On the other hand, the DRs of male speech were broader in the mid- and high-frequency bands (CF>455 Hz). For instance, the DR of male speech in the frequency band of 1375 Hz (CF) was 6.22 dB greater than the DR of female speech in the same band. However, in 12 frequency bands, there was no significant difference between the values obtained from male speech and those obtained from female speech (p>0.05).
In this study, the DRs of the KS-SL-A readings, recorded by both a male and a female speakers, were quantified in 21 segmentalized frequency bands. There were no significant differences between the male and female speakers with regard to the DR when the DRs were averaged across all frequency bands. However, the DRs of the male speech within several frequency bands did differ significantly from those of female speech within the same bands. Specifically, in low frequency bands (CF<455 Hz), the DRs of female speech were greater than those of male speech. Conversely, in mid- to high-frequency bands (CF>455 Hz), the DRs of male speech were greater than those of female speech.
The results of this study differed somewhat from those of Byrne, et al. [11], who reported that the DR of male speech differed from that of female speech by less than 3 dB at the one-third octave bands of 400 Hz, 1 kHz, and 4 kHz. In our study, the DRs of male speakers were significantly different from those of female speakers in nine frequency bands. However, a direct comparison between the current study and that of Byrne, et al. [11] is not appropriate for two reasons. First, the two studies did not use the same band widths. That is, the DRs were calculated based on 1/3 octave bands in the study conducted by Byrne, et al. [11], but the current study used the SII critical band procedure. Second, Byrne, et al. [11] did not investigate the Korean language.
The KS-SL-A was recorded by only one male and one female speaker; this can yield speaker variability issues. However, there were several reasons we used the KS-SL-A as stimuli when quantifying the DR. First, professional voice actors participated in the study, and the voices of both speakers were recorded in the same environment and manner, using the same sentence lists from the KS-SL-A [12]. Second, in a study conducted by Jin and Lee [14], speaker variability for speech recognition when only a male and a female read from the KS-SL-A did not differ significantly from the variability when a group of 10 males and 10 females read from the same list (p>0.05). Moreover, the KS-SL-A was the only standardized sentence material that has been recorded by both male and female speakers. For these reasons, the KS-SL-A were selected as stimuli for the current study. Although this cannot give a true representation of the differences between male and female speakers of the Korean language with regard to DR, our study provides some evidence towards the possibility of difference. To derive a standardized DR for Korean language speakers, further studies are required.
The results of this study indicate the possibility that the DRs of male speech in the Korean language may differ from those of female speech in several frequency bands. This suggests that a standardized DR of male speakers in the band-audibility function of the SII may differ from a standardized DR of female speakers. The findings of this study will be applied in order to determine more accurate intelligibility prediction models, such as the SII.
Acknowledgments
The authors wish to thank James M. Kates for providing information regarding histogram level programs.
References
1. French NR, Steinberg JC. Factors governing the intelligibility of speech sounds. J Acoust Soc Am 1947;19:90ŌĆō119.

2. Plomp R. The negative effect of amplitude compression in multichannel hearing aids in the light of the modulation-transfer function. J Acoust Soc Am 1988;83:2322ŌĆō2327. PMID: 3411024.


3. Croghan NB, Arehart KH, Kates JM. Quality and loudness judgments for music subjected to compression limiting. J Acoust Soc Am 2012;132:1177ŌĆō1188. PMID: 22894236.


4. Dunn HK, White SD. Statistical measurements on conversational speech. J Acoust Soc Am 1940;11:278ŌĆō288.

5. American National Standards Institute. ANSI S3.5-1997 (R2007): Methods for calculation of the speech intelligibility index. New York: Acoustical Society of America;1997.
6. Studebaker GA, Sherbecoe RL, McDaniel DM, Gwaltney CA. Monosyllabic word recognition at higher-than-normal speech and noise levels. J Acoust Soc Am 1999;105:2431ŌĆō2444. PMID: 10212424.


7. Studebaker GA, Sherbecoe RL, Gilmore C. Frequency-importance and transfer functions for the Auditec of St. Louis recordings of the NU-6 word test. J Speech Hear Res 1993;36:799ŌĆō807. PMID: 8377492.


8. Jin IK, Kates JM, Arehart KH. Dynamic range for speech materials in korean, english, and mandarin: a cross-language comparison. J Speech Lang Hear Res 2014;57:2024ŌĆō2030. PMID: 24826909.


9. Klatt DH, Klatt LC. Analysis, synthesis, and perception of voice quality variations among female and male talkers. J Acoust Soc Am 1990;87:820ŌĆō857. PMID: 2137837.


10. Yang B. A comparative study of American English and Korean vowels produced by male and female speakers. J Phon 1996;24:245ŌĆō261.

11. Byrne D, Dillon H, Tran K, Arlinger S, Wilbraham K, Cox R, et al. An international comparison of long-term average speech spectra. J Acoust Soc Am 1994;96:2108ŌĆō2120.

12. Jang HS, Lee JH, Lim DH, Lee KW, Jeon AR, Jung EJ. Development of Korean Standard Sentence Lists for sentence recognition tests. Audiology 2008;4:161ŌĆō177.

13. Kendall T. Speech rate, pause and sociolinguistic variation: studies in corpus sociophonetics. Basingstoke, United Kingdom: Palgrave Macmillan;2013. p.51ŌĆō79.
Fig.┬Ā1
The DR of a female speaker and that of a male speaker, averaged across 21 frequency bands. DR: dynamic rage.

Fig.┬Ā2
The DRs of a female speaker and that of a male speaker in 21 predefined frequency bands (150 Hz to 8600 Hz). Circles represent the DRs of the female speaker and squares represent those of the male speaker. Asterisks indicate frequency bands wherein the DR of the female speaker differed significantly from that of the male speaker. DRs: dynamic rages.


