Analysis of Subway Interior Noise at Peak Commuter Time
Article information
Abstract
Background and Objectives
Although mass transit systems are convenient and efficient for urban people, little attention has been paid to the potential hearing hazard from their noise. The purpose of the current study was to measure and analyze levels of subway interior noise at peak commuter times and to provide information about commuters’ daily dose of noise exposure.
Materials and Methods
To measure the subway interior noise, nine subway lines inside Seoul (i.e., lines 1-9) and six lines surrounding the capital city area (i.e., Central, Bundang, Sinbundang, Incheon, Gyeongui, and Gyeongchun) were chosen. The noise was measured and recorded by a sound level meter for two-hour periods in the morning and evening.
Results
1) In the LZeq analysis, the average noise level of all 15 lines was 72.78 dB; the maximum and minimum noise levels were 78.34 and 62.46 dB, respectively. The average noise level of the nine lines inside Seoul was 73.45 dB, which was 1.68-dB louder than that of the six lines surrounding the capital city area. 2) Based on the LZeq analysis of 33 measured frequencies, 12.5 Hz was the highest frequency and 20,000 Hz was the lowest. 3) There was no remarkable difference in the level of subway interior noise between morning and evening peak commuter times.
Conclusions
We concluded that the level of subway interior noise was not loud enough for commuters to incur noise-induced hearing loss. Regardless, environmental noise control efforts in the subway system might be needed for commuters who take a subway every day.
Introduction
Exposure to various kinds and levels of environmental noise is inevitable for urban people and can adversely affect their health and quality of life [1]. Among the environmental noises, the noise of mass transit systems, particularly subways, has recently been subcategorized as urban noise [2]. The Seoul subway system is one of the largest mass transit systems in the world, with more than 300 stations and roughly 10 million passengers every day [3]. Coupled with its convenience and punctuality, however, the subway system has hidden concerns for health care professionals regarding potential health hazards [1]. Based on published data, the most remarkable and greatest potential health hazard related to the current subway system is noise exposure [2,4,5]. The direct correlation between frequent and excessive noise exposure and possible noise-induced hearing loss (NIHL) is mentioned as a serious problem in public health [5]. Also, many younger individuals who do not have any experience of occupational noise suffer from NIHL with increasing frequency [6]. Furthermore, it is common today for most passengers, including younger people and the middle aged, to wear a portable listening device with earplugs under a high level of subway interior noise [7]. Thus, even though exposure to such noise is short-lived, chronic noise exposure and its hearing insults for subway commuters should not be ignored.
According to a study by Gershon, et al. [2] implemented in the New York subway system, average noise levels on subway platforms and inside subway cars were as high as 93.5 and 94.9 dB, respectively. Three years later, Neitzel, et al. [5] supported previous results and concluded that the platforms and subway cars of the New York subway systems had the highest noise levels among the available forms of public transportation, consequently warning against possible NIHL. When measured in the Seoul subway system, the average noise level was 88 dB and its peak level was 109.2 dB [8]. Although these levels were a little lower than those of the New York system, the Seoul subway system reached up to an average of 105 dB when considering only low frequencies of 1-200 Hz [9]. In short, contemporary researchers have agreed that the noise level inside subway cars is higher than on subway platforms [9]. Nevertheless, little attention has been paid to the level of subway interior noise via a scientific approach or how loud the noise is to which a commuter is exposed in the subway. For example, most previous data had short measurement duration (i.e., 30 to 90 seconds [2], 2 to 10 minutes [5], or 5 minutes [8]) and measured the noise level about 20 years ago [8]. A recent study by Kim [10] selected only three out of several lines in the Seoul subway system and then only measured the noise levels during uncrowded times when few passengers were traveling. To help address the knowledge gaps with respect to noise exposure associated with the interior of subway cars, the present study aimed to measure and analyze levels of subway interior noise during peak commuter times and to provide information about commuters’ daily dose of noise exposure.
Materials and Methods
Measurement of subway interior noise
To measure subway interior noise, nine lines inside Seoul (i.e., lines 1-9) and six lines surrounding the capital city area (i.e., Central, Bundang, Sinbundang, Incheon, Gyeongui, and Gyeongchun lines) were chosen (Fig. 1). Thus, the noise levels of 15 lines were measured.
Seoul metropolitan subway map. 15 subway lines were shown and each line has its name at the end.
The level of subway interior noise was measured and recorded using a sound level meter (Type 2250; Brüel & Kjær, Nærum, Denmark) with a free-field 1/2-inch microphone (Type 4189; Brüel & Kjær) for two-hour periods in the morning (7:00-9:00 am) and evening (6:30-8:30 pm) while considering common commuter times in Korea. It was randomly measured during the weekdays to avoid specific day of the week. The sound level meter and its microphone were placed at the center of a middle room in the subway cars to account for cars crowded with commuters.
Analysis of subway interior noise
To analyze the environmental noise, computer software (BZ-5503 Measurement Partner Suite; Brüel & Kjær) coupled with the sound level meter was used. International standards (i.e., International Electrotechnical Commission (IEC) 61672-1 Class 1, IEC 60651 Type 1 [11]) were applied. In detail, the frequency range was 12.5-20,000 Hz as a function of a oneoctave interval, and units of frequency weighting and time weighting were Z and Fast, respectively, while reflecting the characteristics of continuous subway interior noise. Thus, an equal noise level was used for LZeqa,, and maximum and minimum noise levels were displayed by LZFmaxb, and LZFminc. Finally, descriptive statistics were used to compare the measured noise levels.
Results
Noise levels
In the LZeq analysis, the results revealed that the mean of all 15 lines was 72.78 dB [standard deviation (SD): 3.62]; maximum and minimum noise levels were 78.34 and 62.46 dB, respectively. The average noise of the nine lines inside Seoul was 73.45 dB, which was louder than the average noise of the six lines surrounding the capital city area, at 71.77 dB. Sinbundang (78.34 dB) was the loudest line and Gyeongui (62.46 dB) was the quietest among the 15 lines, while there was about a 15-dB difference. In the LZFmax analysis, the mean of the 15 lines was 87.26 dB (SD: 3.73), with the Central line showing the loudest level (91.94 dB). In the LZFmin analysis, the mean of the 15 lines was 55.18 dB (SD: 7.35), with the Incheon line being the quietest (43.42 dB). In addition, the average of the nine lines inside Seoul was 88.15 dB and 60.64 dB in LZFmax and LZFmin, respectively. The average of the six lines surrounding the capital city area was 85.92 dB and 47.01 dB in terms of LZFmax and LZFmin analysis, respectively.
Table 1 shows the noise level of the 15 subway lines for two-hour periods in the morning and evening peak commuter times. Only a 1.17-dB difference exists in subway interior noise between morning (mean of 15 lines: 72.19 dB, SD: 4.17) and evening (mean of 15 lines: 73.36 dB, SD: 3.68). In the morning, the Sinbundang line was the loudest (79.68 dB) and the Gyeongui line was the quietest (61.64 dB), with an approximately 18-dB difference. This was also the case in the evening: 76.99 dB for the Sinbundang line and 63.27 dB for the Gyeongui line.
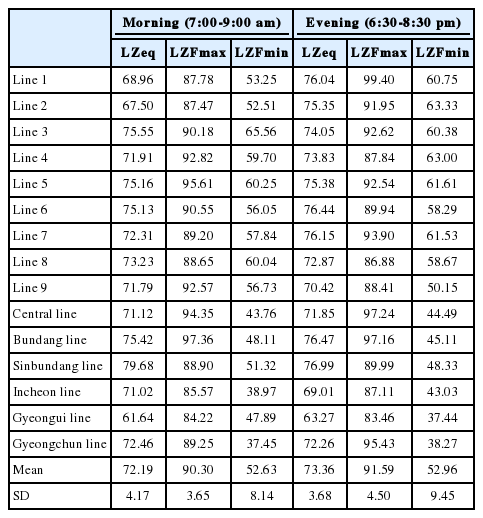
Two-hour average noise level of 15 subway lines in peak commuter times (unit: dB SPL)
Frequency dependency
Fig. 2 shows a graphical analysis of noise levels for the 15 lines as a function of frequency. Based on the LZeq analysis of 33 measured frequencies, 12.5 Hz was the highest level (mean of 15 lines: 80.68 dB, SD: 2.04) and 20,000 Hz was the lowest (mean of 15 lines: 29.59 dB, SD: 3.72). That is, a lower frequency had a much higher noise level, which gradually decreased as the frequency went higher. Unlike the other lines having a similar pattern, the Sinbundang line, which had the loudest noise level, showed a slightly higher peak between 300 and 800 Hz. Also, the Gyeongui line, which was the lowest in both morning and evening, showed lower levels in the frequency range between 200 and 8,000 Hz than the other lines.
Mean level of subway interior noise for 15 Seoul subway lines as a function of frequency.
Discussion
Although medical or surgical treatment for NIHL is still being developed, less noise exposure and active hearing loss prevention are the best approaches to minimize its effect to date [12]. In addition, the negative effects of NIHL on interpersonal communication, quality of life, and work-related issues follow as secondary considerations for the public [1,13]. In this light, the present study measured the interior noise levels of 15 Seoul subway lines in the morning and evening peak commuter times and found that the average noise level was 72.78 dB. Although the level does not reach 85 dB, which might cause NIHL instantly, the noise level should not be ignored because commuters are exposed to 72-73 dB of environmental noise for several minutes to several hours two times per day. Also, the background noise level of 72-73 dB is not low enough to relax if commuters are accustomed to wearing portable listening devices due to double noise exposure [7]. These commuters can increase the volume level of their device up to 90 dB or higher to alleviate the tedium inside the subway [8]. Hong [8] forewarned that this pattern could induce future permanent hearing loss of 15 dB HL at 4,000 Hz for commuters, while providing that hearing sensitivity of 10.25-19.10 dB HL would be increased at 4,000 Hz when people was exposed at noise level of 80-84 dBA for 20 years. Even if considering age effect, the hearing sensitivity could be changed by 31-47 dB HL. More remarkably, 100-8,000 Hz, which is a very important speech frequency range for human conversation, had a noise level of 50-70 dB in most of the subway lines. This level was much lower than that of a previous study conducted by Hong [8], who measured the subway interior noise near the door of the subway car. Therefore, the noise can increase depending on a commuter’s location in the subway car and continue to be harmful in human communication.
As we expected, the noise levels of morning and evening peak commuter times did not differ much at 72.19 dB for the morning and 73.36 dB for the evening. This can be explained by the similar number of commuters in the morning and evening, consequently resulting in a similar noise level. However, we need to think about why the Sinbundang line was the loudest in both morning and evening, even though it had a new subway car. We might infer that its service intervals are longer (i.e., six to eight minutes) than the other lines with two- to three-minute intervals. Moreover, many commuters have moved out of Seoul to new nearby towns such as Bundang, Pangyo, and Suji due to the high cost of housing in Seoul. Also, the Sinbundang line is conveniently connected to Seoul subway lines 2 and 3 which service several big companies and tall buildings. Thus, our results did not support the previous results which indicated that older subway systems were louder [14]. Rather, we found that busy and crowded lines had high noise levels while proving that the average noise level of the nine lines inside Seoul was about 2-dB lower than that of the six lines surrounding the capital city area.
The current study has two limitations which warrant further research. First, to generalize the measured noise levels in the study, we will need several measures per line to obtain accurate results with strong statistical power even though we measured a fairly long period of two hours in the present study and considered the commuter time. Second, because the noise level can be affected depending on subway car conditions and location of the noise measure, measuring the noise levels in different conditions will provide more realistic information about subway interior noise [8]. Regardless, we will expect that the results provide information on the cumulative and synergistic impact of chronic environmental noise exposure for public and health care professionals.
Acknowledgements
This research was completed while being supported by National Research Foundation of Korea (NRF-2014R1A1A1003132, 2017R1A1 A1A05001299).
Notes
Conflicts of interest: The authors have no financial conflicts of interest.
A widely used noise parameter that calculates a constant level of noise with the same energy content as the varying acoustic noise signal being measured. The letter ‘Z’ denotes that the Z-weighting has been included and ‘eq’ indicates that an equivalent level has been calculated.
Maximum time-weighted sound level measured with Z-frequency weighting and Fast time weighting. It is the highest level of environmental noise occurring during the measurement time.
Minimum time-weighted sound level measured with Z-frequency weighting and Fast time weighting. It is the lowest level of environmental noise occurring during the measurement time.