Frequency-Limiting Effects on Speech and Environmental Sound Identification for Cochlear Implant and Normal Hearing Listeners
Article information
Abstract
Background and Objectives
It is important to understand the frequency region of cues used, and not used, by cochlear implant (CI) recipients. Speech and environmental sound recognition by individuals with CI and normal-hearing (NH) was measured. Gradients were also computed to evaluate the pattern of change in identification performance with respect to the low-pass filtering or high-pass filtering cutoff frequencies.
Subjects and Methods
Frequency-limiting effects were implemented in the acoustic waveforms by passing the signals through low-pass filters (LPFs) or high-pass filters (HPFs) with seven different cutoff frequencies. Identification of Korean vowels and consonants produced by a male and female speaker and environmental sounds was measured. Crossover frequencies were determined for each identification test, where the LPF and HPF conditions show the identical identification scores.
Results
CI and NH subjects showed changes in identification performance in a similar manner as a function of cutoff frequency for the LPF and HPF conditions, suggesting that the degraded spectral information in the acoustic signals may similarly constraint the identification performance for both subject groups. However, CI subjects were generally less efficient than NH subjects in using the limited spectral information for speech and environmental sound identification due to the inefficient coding of acoustic cues through the CI sound processors.
Conclusions
This finding will provide vital information in Korean for understanding how different the frequency information is in receiving speech and environmental sounds by CI processor from normal hearing.
Introduction
One of the ecological properties of sounds, either speech or non-speech, is the rich and dynamic representation of spectral information over the frequency range that is important for human sound perception. It is well documented that listeners with normal-hearing (NH) show robust speech intelligibility with partial speech information. For example, NH listeners can show remarkable speech identification performance with temporal envelope or temporal fine structure (TFS) information over few frequency bands [1,2]. When speech signals are passed through low-pass filters (LPFs) or high-pass filters (HPFs) to restrict the speech information in the limited frequency range, NH listeners can still integrate the partial speech information for accurate identification [3-6]. The extent to which listeners can identify speech depends on the available spectrum range usually controlled by varying cutoff frequencies for LPFs and HPFs, and the degree of available sound information such as temporal envelope or TFS. Such information is useful to understand the importance of frequency bands for speech intelligibility for different clinical populations.
One of such populations is cochlear implant (CI) users. CI sound processors analyze the spectrum of the acoustic sound using a bank of band-pass filters (BPFs) or the fast Fourier transform. The number of analysis filters is generally associated with the number of physical stimulating electrodes. When the sound is passed through the set of BPFs, envelope components of sub-band signals are defined and compressed to compensate for the reduced dynamic range found in listeners with severeto-profound hearing loss. The envelopes are then modulated with electrical pulse trains and sent to the corresponding stimulating electrode. Therefore, the CI signal processing itself presents significantly different frequency coding from the physiological processing found for NH listeners. Furthermore, CI sound processors do not efficiently transmit acoustic TFS cues, in which rich spectral information is embedded even though some CI products insist that they are transmitting some TFSs through several electrodes. Ardoint and Lorenzi [5] measured identification of consonants with stimuli that preserve temporal envelope alone, or TFS alone, or both information. Stimuli were passed through either LPFs or HPFs with varying cutoff frequencies to control the amount of possible phonetic cues in the restricted frequency regions. They demonstrated that both envelope and TFS cues convey distinct phonetic information for NH subjects. In particular, the frequency region between 1-2.5 kHz was found to present the most important phonetic cues.
Relevant questions about the use of restricted acoustic cues for speech perception have been addressed by previous studies. For example, Boothroyd, et al. [7] showed that vowels were more susceptible to the effects of spectral smearing than consonants for NH subjects. Xu and Pfingst [8] showed that vowel and consonant recognition for NH subjects listening to vocoder simulations can reach the maximum performance around 8-12 spectral channels. Nie, et al. [9] demonstrated that CI users may rely more on temporal cues for consonant identification, but spectral cues were found to be more important for vowel identification.
Identification of environmental sounds also depends on the accurate representations of spectral and temporal information. Warren and Verbrugee [10] demonstrated that a series of discrete impulses over time may be the primary cue for discriminating the sounds of breaking and bouncing events, while spectral information may not be necessarily required for the perception of such environmental sounds. Gaver [11], however, demonstrated that the impacting wood and metal objects may be discriminated based on the spectral characteristics of the objects. Gygi, et al. [4] suggested that NH listeners may use similar, but not identical, spectro-temporal perceptual mechanisms for identification of speech and non-speech environmental sounds.
The goal of the present study was to evaluate the frequencylimiting effects on sound perception in CI and NH subjects. Comparison of speech identification performance between CI and NH subjects may provide a direct indication of the role of acoustic TFS in speech intelligibility. In addition, the present study employed both speech and non-speech stimuli. For speech stimuli, vowels and consonants of Korean were used and environmental sounds identification was also administered. Identification performance was measured with 7 different cutoff frequencies for LPFs and HPFs without further signal processing. Therefore, NH subjects received both envelope and TFS cues, whereas CI subjects mainly received envelope cues due to the inefficient coding of acoustic TFS through the CI sound processors. The use of multiple sound types is desirable to systematically explore the interaction between the sound type and frequency-limiting effects for CI and NH subjects.
Subjects and Methods
Subjects
Ten CI users (2 females, 8 males) participated in this study. The selection criteria for CI subjects included: 1) the onset of post-lingual profound hearing loss which could preclude any effects of language and developmental factors on sound recognition ability, 2) a pure tone threshold better than 40 dBHL in the frequency range between 250 Hz and 6,000 Hz to ensure proper functioning of CI devices, 3) 95% or greater open-set sentence recognition score, and 4) at least one year of duration of CI use prior to this study. These selection criteria generally provide high performing CI subjects with tightly controlled etiological and cognitive factors. Table 1 shows the demographic information for CI subjects. All CI subjects had fully inserted electrodes and used all available channels in their speech coding strategies. During testing, CI subjects used the most recent and adapted clinical maps that had been used for more than 6 months. No subject used a hearing aid in the contralateral ear during the experiment.
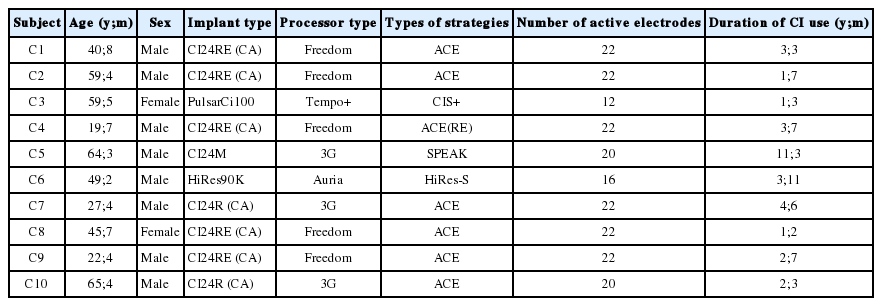
Individual CI subject information
Ten NH subjects also participated in this study. NH subjects met the selection criteria of hearing thresholds better than 20 dB HL in each ear at 250, 500, 1,000, 2,000, 4,000, and 6,000 Hz. The mean age of NH subjects was 21 years with a range between 19 and 22 years. All experimental procedures were approved by the Human Subjects Committee and Institutional Review Boards at Seoul National University (H1006-032-320) and Yonsei University (4-2010-0246). Informed consent was obtained from each subject prior to testing. All subjects were paid for participation.
Experimental stimuli
There were 3 sets of stimuli which were vowels and consonants in Korean and environmental sounds. Seven vowels were produced and recorded in the /hVd/ context. The seven vowels were /애, 이, 으, 아, 우, 오, and 어/ in Korean that correspond to /ɛ, i, ɯ, ɑ, u, o, and ʌ/ in the International Phonetic Alphabet system, respectively. Nineteen consonants were produced: /ㄱ, ㄴ, ㄷ, ㄹ, ㅁ, ㅂ, ㅊ, ㅂ, ㅊ, ㅋ, ㅌ, ㅍ, ㅎ, ㄲ, ㄸ, ㅃ, ㅆ, ㅉ, and ㅇ/. These consonants can be represented as /k (g), n, t (d), l (ɾ), m, p (b), s, tɕ, tɕh, kh, th, ph, h, k*, t*, p*, s*, tɕ*, and ŋ/. We focused on the 7 monothongs in Korean vowel system to avoid floor effect in discrimination caused by diphthongs [12] and all the consonants in Korean to ensure speech discrimination power. The Consonants were produced with pre-vocalic (/Consonant+a/, Ca), inter-vocalic (a+Consonant+a/, aCa), and post-vocalic (/a+ Consonant/ aC) positions. Finally, 18 monosyllables (/Ca/) for the prevocalic position, 18 disyllables (/aCa/) for the inter-vocalic position, and 7 monosyllables (/aC/) for the post-vocalic position were chosen for consonant identification. These positions represent all possible vowel-consonant combinations in Korean.
Nine different environmental sound clips were used including bird, rooster, duck, alarm, doorbell, breaking glass, thunder, cello, and wood cutting, which are categorized in animal (bird, rooster, and duck), nature (thunder), household (doorbell), and wooden and metallic (alarm, breaking glass, and wood cutting) sounds. These sounds have been used in prior studies [13].
Filtering procedure
The speech and environmental stimuli were digitized at a sampling rate of 44.1 kHz and quantized at a 16-bit resolution. To restrict the spectral information of sounds, the stimuli were filtered with varying cutoff frequencies using 12th-order, zero-phase delay Butterworth filters (72 dB/octave slopes). For the LPF condition, the lower cutoff frequency (fL) was set to 100 Hz, and six different upper cutoff frequencies (fHs) were used: 750, 1,000, 1,500, 2,500, 3,500, and 5,000 Hz. For the HPF condition, the fH was fixed at 8,000 Hz, and six different fLs: 750, 1,000, 1,500, 2,500, 3,500, and 5,000 Hz. In addition, the full band condition (100-8,000 Hz) as well as the original condition (i.e., unfiltered) were also tested. These frequency bands were chosen on the basis of a pilot experiment in order to obtain measurable recognition scores for each condition.
Test procedure
A single loudspeaker [MA-15D, Roland Edirol (Roland Corporation, Shizuoka, Japan) with a frequency and phase response that exceed American National Standard Institute (ANSI) standards for speech audiometry], positioned 1-meter in front of the subjects, presented stimuli in the sound field at 65 dBA. All tests were conducted in a double-walled, sound-attenuating booth. Before testing, all subjects were initially trained to identify speech and environmental sounds in the original condition. Subjects were presented with each speech and environmental sound clip with visual feedbacks. For the actual testing, custom MATLAB (The Mathworks, Natick, MA, USA) programs implementing the method of constant stimuli were used to present the stimuli in random order. For vowel identification, a 7-alternative forced-choice (AFC) procedure was used to measure identification scores. For consonant identification, three different sets of testing were performed separately for the pre-vocalic consonants with an 18-AFC procedure, the inter-vocalic consonants with an 18-AFC procedure, and the post-vocalic consonants with a 7-AFC procedure. Each vowel and consonant was presented once for male and female speaker. Lastly, environmental sound identification was measured using a 9-AFC procedure. The order of the experimental conditions (vowels, consonants, environmental sounds) was randomized within and across subjects. For each stimulus type, types of filtering (original, full-band, low-pass, or high-pass filtering) and cutoff frequencies were also administered in random order within and across subjects.
Data analysis
The total number of stimulus presentation for each subject was 1,526, creating a total number of 30,520 responses from all NH and CI subjects. Percent correct scores for identification tests were corrected for chance level and then transformed to rationalized arcsine units (RAUs). The rationalized arcsine transform [14] was applied to the proportions of correct responses in order to make the identification scores follow a normal distribution. Therefore, a RAU value of 0 in this paper represents performance at chance level. Note that three different sets of consonant identification were performed separately. Identification scores (in chance-corrected RAU) for these three conditions were averaged to compute the final consonant identification score for each individual subject. All statistical analyses were performed using SAS (SAS Institute, Cary, NC, USA) based on the chance-corrected RAU scores.
Results
Fig. 1 shows the mean vowel identification scores across CI subjects (upper panels) and across NH subjects (lower panels) as a function of cutoff frequency for male (left panels) and female (right panels) speakers. For the LPF conditions, identification performance increased as the cutoff frequency increased. For the HPF conditions, identification performance decreased as the cutoff frequency increased. Overall, NH subjects showed better identification performance than CI subjects. In the multiple independent samples t-tests between CI and NH subjects, the criterion for statistical significance was divided by 7 (i.e., α=0.007) to correct for the number of comparisons. NH subjects showed significantly better identification performance than CI subjects which are shown by the asterisks under the data points except for the few testing conditions. NH subjects showed nearly perfect identification performance for the full-band condition. Here, 90 RAU indicates perfect identification performance. In addition, NH subjects showed nearly perfect identification at cutoff frequencies above 1,500 Hz for the LPF conditions, whereas CI subjects showed an improvement in identification performance beyond 1,500 Hz cutoff frequency. Likewise, for the HPF conditions, NH subjects showed nearly perfect identification (particularly for female speaker) up to 1,500 Hz cutoff frequency; and beyond it, identification performance dropped.
Mean vowel identification scores across subjects in chance-corrected, RAUs. Filled and open circles represent the low-pass filtering and high-pass filtering conditions, respectively. Error bars represent ± one standard errors about the mean across subjects. The asterisks under the scores in the upper panels show the significant difference in the performance (α=0.007) between CI and NH subjects based on multiple independent samples t-tests. A: CI subjects, male speaker. B: CI subjects, female speaker. C: NH subjects, male speaker. D: NH subjects, female speaker. CI: cochlear implant, NH: normal hearing, RAU: rationalized arcsine unit.
A 2×7 repeated measures analysis of variance (ANOVA) with the main factors of speakers (male vs. female) and cutoff frequencies (7 cutoffs for each LPF and HPF condition) was performed on CI and NH subjects’ RAU scores (Table 2). This ANOVA analysis was performed separately for the LPF and HPF conditions, because the frequency range for each cutoff frequency differs for the two testing conditions (e.g., when a cutoff frequency was set to 1,000 Hz, the LPF condition covers 100-1,000 Hz, whereas the HPF condition covers 1,000-8,000 Hz). For both CI and NH subjects, and for both the LPF and HPF conditions, the main effect of cutoff frequency reached significance, indicating that vowel identification performance changed significantly with different frequency range available for listeners. The effect of speakers did not reach significance except for the HPF condition in NH subjects.
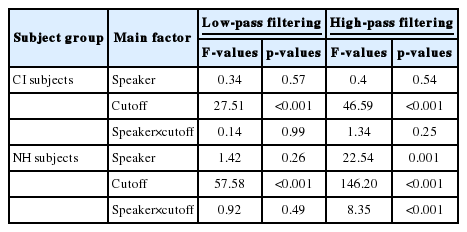
Results for the 2×7 repeated measures analysis of variance for vowel identification
In consonant identification, overall, NH subjects also showed better identification performance than CI subjects. For the HPF conditions, identification performance was consistently high for cutoff frequencies below 1,000 Hz in NH subjects, but CI subjects showed further improvement for cutoff frequencies below 1,000 Hz. For the LPF conditions, identification performance appears to be maxed out at 3,500 Hz for both CI and NH subjects (Fig. 2). For both CI and NH subjects and for both the LPF and HPF conditions, the effects of speaker and cutoff frequency reached significance in consonant identification (Table 3).
Mean consonant identification scores across subjects. Data format is identical to that of Fig. 1. The asterisks under the scores in the upper panels show the significant difference in the performance (α=0.007) between CI and NH subjects based on multiple independent samples ttests. A: CI subjects, male speaker. B: CI subjects, female speaker. C: NH subjects, male speaker. D: NH subjects, female speaker. CI: cochlear implant, NH: normal-hearing, RAU: rationalized arcsine unit.

Results for the 2×7 repeated measures analysis of variance for consonant identification
Fig. 3 shows the mean environmental sound identification results. As with the vowel and consonant identification, environmental sound identification performance changed as a function of cutoff frequency (Table 4 for ANOVA results). For the HPF conditions, NH subjects showed perfect identification performance for cutoff frequencies below 1,000 Hz. Above 1,000 Hz cutoff frequency, NH subjects showed nearly perfect identification performance for the LPF conditions. CI subjects showed a gradual change in identification performance for the HPF conditions as the cutoff frequency increased. For the LPF conditions, CI subjects showed the peak at 3,500 Hz, but performance for cutoff frequencies above 2,500 Hz was not significantly different each other (paired t-test, p>0.05).
Mean environmental sound identification scores across subjects. Data format is identical to that of Fig. 1, 2. The asterisks under the scores in the upper panels show the significant difference in the performance (α=0.007) between CI and NH subjects based on multiple independent samples t-tests. A: CI subjects. B: NH subjects. CI: cochlear implant, NH: normal-hearing, RAU: rationalized arcsine unit.

Results for the 2×7 repeated measures analysis of variance for environmental sound identification
Pearson correlation coefficients were computed between vowel/consonant identification (averaged across male and female speakers) and environmental sound identification (Fig. 4). Significant correlations were found between speech and environmental sound identification for CI subjects (r= 0.87, p<0.001) and for NH subjects (r=0.88, p<0.001).

Environmental sound identification scores plotted against speech identification scores (mean across vowel and consonant identification). Each symbol corresponds to the speech type and filtering conditions. The Pearson correlation coefficient is computed including all data points in each figure. A: CI subjects. B: NH subjects. CI: cochlear implant, NH: normal-hearing, RAU: rationalized arcsine unit.
Two different psychometric curves were derived for the LPF and HPF conditions for each individual subject. The function was generated using the nonparametric local linear approach [15] with inputs of identification scores (in percent correct) and the base-2 logarithm of the cutoff frequencies, as used by Whitmal and DeRoy [6]. The intersection point between the psychometric functions for the LPF and HPF conditions was assessed to determine the “crossover frequency.” The crossover frequency describes the frequency boundary, where above or below it, 50% of intelligible phonetic information is transmitted [16,17]. The crossover frequency is generally speech material dependent. Table 5 shows the crossover frequencies for vowel, consonant, and environmental sound identification.

Crossover frequencies (in Hz) for vowel, consonant, and environmental sound identification
CI subjects showed a minimal change in the mean crossover frequency between vowels and consonants or between male and female speakers. However, NH subjects showed larger differences in the mean crossover frequency between vowels and consonants or between male and female speakers. This pattern is confirmed by a 2×2 repeated measures ANOVA with factors of stimulus type (vowels and consonants) and speaker (male and female) performed separately for CI and NH subjects. For CI subjects, the effects of both factors did not reach significance at the 0.05 level [F(1,9)=1.61, p=0.24 for stimulus type; F(1,9)=0.43, p=0.53 for speaker]. However, NH subjects showed significant main effects of both factors on the crossover frequency [F(1,9)=24.73, p=0.001 for stimulus type; F(1,9)=25.43, p=0.001 for speaker].
Figs. 1-3 show that there was a change in identification performance between two adjacent cutoff frequencies. Here, gradients refer to the change in performance with respect to cutoff frequency. To examine the contribution of a frequency band to identification performance, gradients were computed for group data for the LPF and HPF conditions. For example, at the cutoff frequency 1,000 Hz, the gradient for the LPF condition can be computed by subtracting the identification score at 750 Hz cutoff frequency (i.e., available frequency range: 100-750 Hz) from the identification score at 1,000 Hz (i.e., available frequency range: 100-1,000 Hz). Therefore, the gradient at 1,000 Hz for the LPF condition estimates the contribution of a frequency band between 750-1,000 Hz to the identification performance. All gradient values were computed based on RAU scores and they were normalized by the difference between two adjacent cutoff frequencies (on an equivalent rectangular bandwidth, or ERBN scale).
In Fig. 5, gradients for vowel, consonant, and environmental sound identification are plotted as a function of cutoff frequency. In general, NH subjects showed greater gradients than CI subjects, suggesting that NH subjects showed greater performance changes between two adjacent cutoff frequencies. For the LPF condition, the distributions of gradients were skewed to the low frequency side regardless of stimulus type. For the HPF condition, the peak of the distribution of gradients for CI subjects is located in the middle frequency side except for the environmental sounds. NH subjects, however, showed the peak of the distribution of gradients for the HPF conditions at frequencies around 2.5-3.5 kHz for vowels, 3.5 kHz for consonants, and 8 kHz for environmental sounds.

Mean gradients across subjects for the low-pass filtering (top panels) and high-pass filtering (bottom panels) filtering conditions. In each figure, gradients are plotted as a function of cutoff frequency for vowel (open bars), consonant (light-hatched bars), and environmental sound (darkhatched bars) identification. Gradient values are shown in chance-corrected, RAUs, normalized by theERBN for thecorrespondingbandwidthbetween two adjacent cutoff frequencies. A: CI subjects. B: NH subjects. CI: cochlear implant, NH: normal-hearing, RAU:rationalized arcsine unit, ERBN: equivalent rectangular bandwidth.
To capture the precise effects of each factor on the gradients, a 3×2×7 repeated measures ANOVA (3 stimulus types; 2 filtering conditions, 7 cutoff frequencies) was performed for CI and NH subjects separately. For CI subjects, all three factors had significant effects [F(2,18)=5.0, p=0.019 for stimulus type; F(1,9)=10.27, p=0.011 for filtering conditions; F(6,54)= 3.50, p=0.005 for cutoff frequency]. All two-way interactions also reached significance at the 0.05 level, but three-way interaction did not reach significance [F(12,108)=1.35, p= 0.20]. For NH subjects, all three factors also had significant effects [F(2,18)=7.59, p=0.004 for stimulus type; F(1,9)= 134.47, p<0.001 for filtering conditions; F(6,54)=4.85, p=0.001 for cutoff frequency]. All two-way as well as three-way interactions reached significance.
Discussion
In the present study, both CI and NH subjects were presented with sounds that were passed through either low-pass or HPFs. The filtered signals were not further processed using any vocoder processing. Therefore, NH subjects received both temporal envelope and fine structure information in the restricted frequency region. CI subjects, however, mainly received the temporal envelope information while the encoding of acoustic TFS information was very limited due to the use of fixed-rate, pulsatile stimulation. For the most conditions in the present study, CI subjects showed significantly worse identification scores than NH subjects. There were just few conditions where there was not a significant difference in identification performance between the two groups. For example, when vowel formants in the low frequency region were discarded by the HPF with cutoff frequency above 2,500 Hz, both groups equally performed worse.
Ardoint and Lorenzi [5] also demonstrated differences in consonant identification between the stimuli having both envelope and TFS information (i.e., intact speech condition in their study) and stimuli preserving envelope information over 16 frequency bands (i.e., E-speech condition in their study by using 16-band tone envelope vocoders). The magnitude of difference in performance between CI and NH subjects in the present study appears to be greater than the magnitude of difference in performance between the intact and E-speech conditions in Ardoint and Lorenzi [5]. This may be partly due to the fact that the baseline performance for the full-band condition was better for NH subjects presented with E-speech stimuli in Ardoint and Lorenzi [5] compared to CI subjects in the present study. That is, at the full-band condition, NH subjects in Ardoint and Lorezi [5] showed nearly perfect identification performance with E-speech stimuli for a male speaker, whereas CI subjects in the current study showed 55% of identification performance for consonants produced by a male speaker.
Shafiro [18] tested NH subjects on an environmental sound identification test in a 60-alternative forced choice paradigm, and Shafiro, et al. [19] administered the same environmental sound identification test for CI subjects. CI subjects in Shafiro, et al. [19] showed average identification performance of 45.3%. When NH subjects were presented with spectrally degraded stimuli (8-, 16-, and 24-channel noise vocoders), they showed average performance between 60-70% [17], which is apparently higher performance than CI subjects tested on the same environmental identification task. Taken together, these previous studies along with the present study highlight the difference in speech and environmental sound identification between CI and NH subjects. The difference in performance between the two subject groups may be attributed to multiple factors such as the inefficient coding of acoustic TFS information and poor spectral resolution due to the limited numbers of stimulating electrodes and channel interactions.
The range of mean crossover frequencies for vowel and consonant identification for NH subjects in this study were generally consistent with previously reported values using English [20-22], Cantonese [23], or Korean [24]. It is an interesting finding that the crossover frequency in the environmental sound identification is similar to that in the speech sound identification in this study. The significant effect of speaker on the crossover frequency for NH subjects is consistent with the results of Ardoint and Lorenzi [5] who also reported similar significant effects of speaker (male vs. female) on the crossover frequency for NH subjects listening to intact or vocoded consonants. The non-significant effects of stimulus type and speaker on the crossover frequency for CI subjects may suggest that CI subjects are generally less sensitive to the changes in acoustic stimuli. In addition, the difference in the mean crossover frequencies between CI and NH subjects may reflect the fact that the frequency-place map for electric and acoustic hearing differ due to multiple factors such as the frequency allocation of BPFs associated with stimulating electrodes, the actual position of electrodes in the cochlea, and spectral smearing effects by the spread of excitation [25-28].
Vowels were more susceptible for frequency information than consonants in Korean, which is consistent to the results of Boothroyd, et al. [7] For vowels and consonants, 1-1.5 kHz is the crucial area for providing phonetic information in NH subjects. Both group performed similarly poor on vowel identification with the HPF for cutoff frequencies above 2.5 kHz. CI subjects, however, were able to utilize frequency information mainly up to 2.5 kHz especially for consonant identification. This is interesting because CI subjects showed significantly poor performances with cutoff frequencies above 2.5 kHz compared to NH subjects in consonant identification. This means that NH subjects still utilize the acoustic information above 2.5 kHz for consonant identification, but this was not the case for the CI subjects although they need higher frequency information to identify consonants.
The significant relationship between speech and non-speech environmental sound identification shown in Fig. 4 suggests that speech and environmental sounds may share similar pattern of perception and acoustic features [4,29]. For example, both speech and environmental sound generally require fine spectral resolution for better identification outcomes particularly for CI users [8,9,19,30]. Shafiro [18] demonstrated that environmental sound identification improved with increasing spectral resolution in NH subjects listening to vocoded stimuli. Using 17 CI users, Shafiro, et al. [31] reported significant correlations between environmental sound identification and sentence, consonant, monosyllabic word recognition in quiet, as well as sentence recognition in background noise. Therefore, on the one hand, a similar perceptual mechanism might drive identification performance for speech and non-speech environmental sounds. This might be one of the reasons that the crossover frequency is similar between speech sounds and environmental sounds.
On the other hand, however, gradients were significantly different across stimulus type (vowels, consonants, environmental sounds), filtering conditions (LPF vs. HPF), and cutoff frequencies both for CI and NH subjects. This may suggest that the frequency-limiting effects may be differential across listening tasks. From the acoustic perspective, this is due to the fact that as a function of frequency band, the amount of useful acoustic information for identification task may differ across vowels, consonants, and environmental sounds. For example, as the cutoff frequency for the HPF increased, important linguistic information such as formants was not transmitted to subjects that are important for vowel identification; hence, vowel identification performance markedly decreased.
However, listeners can utilize both temporal and spectral acoustic information for environmental sound identification. In fact, previous studies have suggested that listeners may put more emphasis on the temporal features of environmental sounds such as attack and decay characteristics [4,10,29], thus the net effect of frequency-limiting may be less for environmental sound identification than for vowel or consonant identification. This is supported by the fact that the magnitude of difference in identification performance between the lowest and highest cutoff frequencies was smaller for environmental sound identification than for speech identification (CI subjects: 11.3 RAU and 32.6 RAU differences for the LPF and HPF conditions, respectively; NH subjects: 21.5 RAU and 38.7 RAU differences for the LPF and HPF conditions, respectively). In addition, performance at the most extreme cutoff frequencies such as 750 Hz for the LPF, and 5,000 Hz for the HPF, environmental sound identification performance was still fairly good for both CI (50 RAU at 750 Hz cutoff for the LPF; 28 RAU at 5,000 Hz cutoff for the HPF) and NH (68 RAU at 750 Hz cutoff for the LPF; 51 RAU at 5,000 Hz cutoff for the HPF) subjects, whereas speech identification at these extreme cutoff frequencies were very low, particularly in CI subjects. These results suggest that, although the overall pattern of identification performance as a function of cutoff frequency for the LPF and HPF conditions changed in a similar manner for speech and non-speech environmental sounds, listeners showed more robust identification performance for environmental sounds than for speech.
The effects by spectral and temporal features in sound need to be investigated further. This study also suggested that environmental sound discrimination would be considered more to evaluate perception status of the CI users and/or to bridge the sound perception training stages in more discrete steps to get better speech perception. There were not many findings demonstrating Korean-specific speech perception characteristics in the current study so that there should be more studies to reveal language-specific perceptual features which might improve sound processing for the CI users.
In conclusion, The present study demonstrated substantial differences were found in overall identification performance, crossover frequencies, and gradients between CI and NH subjects, indicating the alteration of acoustic information through the CI processing. The approach in this study may provide more detailed analysis of the effects of novel CI sound processing strategies or mapping parameters on speech or environmental sound identification, because it enables to reveal the potential advantages or disadvantages of CI sound processing strategies in restricted frequency bands. Typical speech identification tests, where the entire frequency information is presented altogether, are not feasible to provide such information. This point may be particularly important when evaluating CI performance for different languages.
Acknowledgements
This study is a part of doctoral dissertation of the first author. It is dedicated to the late Dr. Won-Sang Lee who were a keen and considerate scientist as well as a passionate doctor and had enormously contributed to this study.
Notes
Conflicts of interest: The authors have no financial conflicts of interest.