A Personal Sound Amplification Product Compared to a Basic Hearing Aid for Speech Intelligibility in Adults with Mild-to-Moderate Sensorineural Hearing Loss
Article information

Abstract
Background and Objectives
This study aimed to compare functional hearing with the use of a personal sound amplification product (PSAP) or a basic hearing aid (HA) among sensorineural hearing impaired listeners.
Subjects and Methods
Nineteen participants with mild-to-moderate sensorineural hearing loss (SNHL) (26-55 dB HL; pure-tone average, 0.5-4 kHz) were prospectively included. No participants had prior experience with HAs or PSAPs. Audiograms, speech intelligibility in both quiet and noisy environments, speech quality, and preference were assessed in three different listening conditions: unaided, with the HA, and with the PSAP.
Results
The use of PSAP was associated with significant improvement in pure-tone thresholds at 1, 2, and 4 kHz compared to the unaided condition (all p<0.01). In the quiet environment, speech intelligibility was significantly improved after wearing a PSAP compared to the unaided condition (p<0.001), and this improvement was better than the result obtained with the HA. The PSAP also demonstrated similar improvement in the most comfortable levels compared to those obtained with the HA (p<0.05). However, there was no significant improvement of speech intelligibility in a noisy environment when wearing the PSAP (p=0.160). There was no significant difference in the reported speech quality produced by either device or in participant preference for the PSAP or HA.
Conclusions
The current result suggests that PSAPs provide considerable benefits to speech intelligibility in a quiet environment and can be a good alternative to compensate for mild-to-moderate SNHL.
Introduction
Hearing impairment is known to limit communication and social activity [1], leading to a lower quality of life and decreased cognitive function [2]. In the past, the majority of surveys on the need for hearing rehabilitation covered only bilateral hearing loss greater than 40 dB. However, recent studies have reported that individuals with minimal to mild hearing loss also have difficulties understanding speech under adverse listening conditions and have a poorer quality of life [3,4]. Hearing aids (HAs) are an effective rehabilitative option for improving communication as well as the psychosocial well-being of individuals with hearing loss. While the benefits of HAs have been well-documented, less than 20% of adults with hearing loss was reported as HA users [5,6]. Furthermore, only 0.47% of individuals with minimal hearing loss reported using HAs even when they suffered subjective hearing difficulty [7]. Cost is considered to be one of the reasons for the low adoption rate of HAs [8]. According to the MarkeTrak VII survey, 76% of non-adapters mentioned finances as a barrier to the adoption of conventional HAs [9].
Personal sound amplification products (PSAPs) are defined by the US Food and Drug Administration (FDA) as wearable electronic products intended to be used by consumers without hearing impairment to amplify sounds in certain environments [10]. This specific category of amplification is separate from traditional HAs, as PSAPs are not meant to be used to compensate for hearing loss and are therefore not regulated as a medical device by the US FDA [11]. Because PSAPs are intended to be sold directly to consumers, they can be considered a type of over-the-counter (OTC) amplification device. In general, PSAPs are less expensive and simpler sound amplification devices with fewer features and less functionality than digital HAs. However, some PSAPs are technologically comparable with basic HAs. Although PSAPs are not intended to compensate for impaired hearing, it was found that approximately 1.5 million people with hearing impairment use either a PSAP or OTC device to compensate for their hearing loss [12].
Previous research suggested that certain higher-end PSAPs may be appropriate to use for those with mild-to-moderate hearing loss [12-14]. A more recent study has compared five PSAPs with a conventional HA in older adults with mild-to-moderate hearing loss [15]. Results in speech recognition performance in noise indicated that three of the five PSAPs performed comparable to an HA. However, many studies focused on electroacoustic characteristics. There is still insufficient data on PSAP performance. Additionally, other studies showed that PSAPs do not provide sufficient gain for high frequencies, so people have very low satisfaction with PSAPs [16,17]. Therefore, a conventional HA and a PSAP need to be compared using a comprehensive method. The present study evaluated the performance of a PSAP and a basic HA among adults with mild-to-moderate hearing loss.
Subjects and Methods
Participants
From October 2015 through January 2016, a total of 19 participants with no experience with any hearing assistive devices, such as HAs or PSAPs, were prospectively enrolled. Patients with otitis media and conductive hearing loss were excluded from the study. All participants had mild-to-moderate sensorineural hearing loss (SNHL) (26-55 dB HL; pure-tone average from 500-4,000 Hz) in the tested ear. If the participants had mild-to-moderate SNHL in both ears, the ear with better hearing was selected as the tested ear.
Ethical statement
All participants were recruited and tested at the Samsung Medical Center Hearing Research Laboratory. Every participant provided written informed consent to participate in this study. The study protocol was approved by the Samsung Medical Center Institutional Review Board (IRB No. 2015-06-064). This study was carried out in accordance with approved guidelines.
Intervention
Participants were fitted with a PSAP (PS2500AMP, Able Planet, North Wheat Ridge, CO, USA) and an HA (AudéoTM Q, Phonak AG, Stäfa, Switzerland) unilaterally. The Able Planet PS2500AMP (Able Planet) in-ear amplifier has 8 channels with 12 gain adjustment bands, noise reduction, feedback cancellation, and directionality. The participants selected their preferred amplification mode among 4 presets after listening to the Korean standard sentence lists for adults (KS-SL-A) of the Korean Standard Audiometry (KSA) test [18] in a quiet environment. The PSAP contains a ‘natural directionality’ feature as the default, and its settings could not be modified. The Phonak AudéoTM Q (Phonak AG) HA was also a canal-style receiver with 8 channels. The HA was fitted to the National Acoustic Laboratories’ non-linear prescription, version 2 (NAL-NL2) formula by an experienced audiologist [19,20]. All functions of the HA were disabled apart from noise reduction, automatic directionality, and feedback cancellation.
The Frye Fonix® 7000 Hearing Aid Test system (Frye Electronics, Beaverton, OR, USA) was used for measuring coupler gain. Multi-curve coupler gain of digital speech was analyzed at input levels of 40, 60, and 80 dB sound pressure level (SPL). The coupler gain of the HA was measured for each participant in accordance with NAL-NL2, and the coupler gain of the PSAP was measured for each amplification mode. Participants were blinded to information about the hearing devices.
Outcome measures
Four main test batteries were administered: 1) an audiogram, 2) speech intelligibility in a quiet environment, 3) speech intelligibility in a noisy environment, and 4) a self-rating questionnaire. Participant performance was compared across three different listening conditions: unaided, with an HA, and with a PSAP. All tests were administered monoaurally, and a ear plug was inserted in the non-tested ear. The order of wearing devices was randomized.
Audiograms
Pure-tone threshold and word recognition score (WRS) were measured using a Madsen Orbiter 922 audiometer (Madsen Electronics, Taastrup, Denmark) and TDH-39P headphones (Telephonics, Farmingdale, NY). Pure-tone thresholds were obtained at 0.25, 0.5, 1, 2, 4, and 8 kHz using an ascending 5-dB method (modified Hughson-Westlake method) [21]. The WRS was measured using KS-MWL-A [22] at the most comfortable level (MCL).
Speech intelligibility
Speech reception thresholds (SRTs) were measured in quiet and noisy test conditions using the Korean version of Hearing in Noise Test (K-HINT) sentences [22]. The study participant sat on a chair in the center of the sound field facing 2 loudspeakers (HS-50M, Yamaha, Japan) located approximately 1 m away at the 0° azimuth. The target sentences in K-HINT and speech-shaped noise were presented from two front loudspeakers (0°). The presentation level of the noise was fixed at 65 dBA, and the level of target sentences varied according to the adaptive procedure of the original HINT [22]. One list of twenty sentences was randomly selected from a total of twelve lists. Results of the K-HINT were presented as dB HL and SNR; speech levels corresponding to 50% correct recognition of sentences in quiet and noisy testing condition, respectively.
Speech quality
Speech quality was assessed using the eighth KS-SL-A of the KSA test and speech-shaped noise (0-dB SNR). Participants were asked to rate the quality of sound using a five-point numerical scale recommended by the International Telecommunication Union (ITU) [23,24]. The quality of speech was assessed by rating speech signal alone, the background noise alone, and the overall effect of speech and noise on quality using the following parameters: 1) the speech signal alone using an absolute category rating (ACR, “Excellent,” “Good,” “Fair,” “Poor,” and “Bad”), 2) the speech signal alone using a scale of signal distortion (SIG, “Not distorted,” “Slightly distorted,” “Somewhat distorted,” “Fairly distorted,” and “Very distorted”), 3) the background noise alone using a scale of background intrusiveness (BAK, “Not noticeable,” “Slightly noticeable,” “Noticeable but not intrusive,” “Somewhat intrusive,” and “Very intrusive”), and 4) the overall effect of speech and noise on quality (OVL, “Excellent,” “Good,” “Fair,” “Poor,” and “Bad”). The five-level categorical scales were converted to numerical scores, where “Excellent,” “Not distorted,” or “Not noticeable” corresponded to a score of 5 and “Bad,” “Very distorted,” or “Very intrusive” to 1. The mean opinion score (MOS) is obtained from the four component scores (ACR, SIG, BAK, and OVL) was determined as follows: MOS=
Preference test
Device preference was assessed using a comparison category rating (CCR) under quiet and noisy test conditions (speechshaped noise, 0 dB SNR). Participants were asked to listen to the first and second KS-SL-A test at the MCL, and to select their preferred device (HA or PSAP). The CCR test is designed to quantify the degree of preference on a six-point scale with the rating of 0 indicating “No device preference,” 1 indicating “Very slightly better,” 2 indicating “Slightly better,” 3 indicating “Better,” 4 indicating “Much better,” and 5 indicating “Very much better.” Positive and negative numbers are used to account for both directions of preference (positive for HA and negative for PSAP). The resulting preference value of the CCR test is presented as a comparison mean opinion score (CMOS).
Statistical analysis
Results were analyzed using SPSS 18.0 (SPSS Inc., Chicago, IL, USA). To compare the pure-tone thresholds, WRS, MCL, speech intelligibility, and speech quality among the three listening conditions (unaided, with the HA, and with the PSAP), repeated measures one-way analysis of variance (RM-ANOVA) or Friedman tests were conducted depending on normality. If there were significant differences among the three listening conditions, post hoc tests using the Bonferroni correction or Wilcoxon signed-rank test were performed to evaluate differences between two different listening conditions (i.e., unaided vs. HA-aided, unaided vs. PSAP-aided, and HA-aided vs. PSAP-aided). Post hoc analyses with Wilcoxon signedrank tests were conducted with the Bonferroni correction applied, resulting in a significance level of p<0.017.
Result
Participants
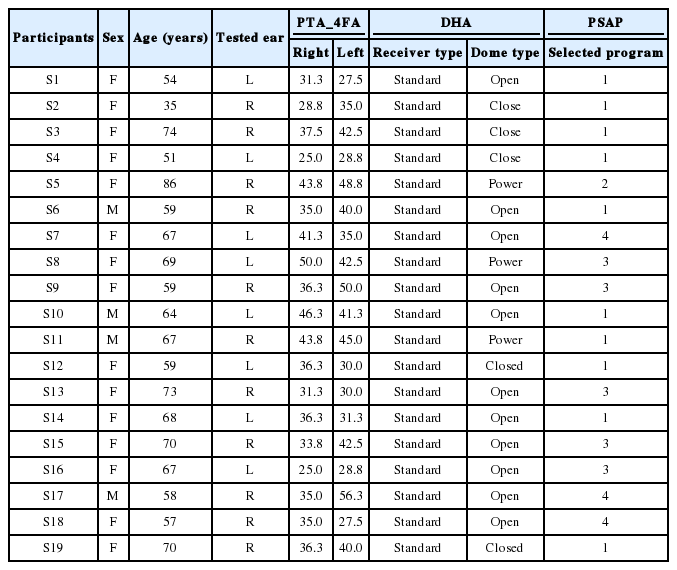
A total of 19 participants (4 males, 15 females, age range 35-86 years, average 64 years) with mild-to-moderate SNHL were prospectively enrolled. Individual clinical and device information is presented in Table 1. The preferred amplification mode for the PSAP was Program 1 (n=10), followed by Program 3 (n=5), Program 4 (n=3), and Program 2 (n=1).
Demographics and device information
Coupler gain
Fig. 1A-D shows coupler gain for the PSAP according to amplification mode at inputs of 40, 60, or 80 dB SPL. Fig. 1E shows mean coupler gains with 95% confidence intervals for the HA at inputs of 40, 60, or 80 dB SPL after fitting with NAL-NL2. Most gain programs in PSAP prescribed similar coupler gains throughout all frequencies, except at 8 kHz. On the other hand, the HA fitted with NAL-NL2 provided greater coupler gain above 1 kHz than below 1 kHz.
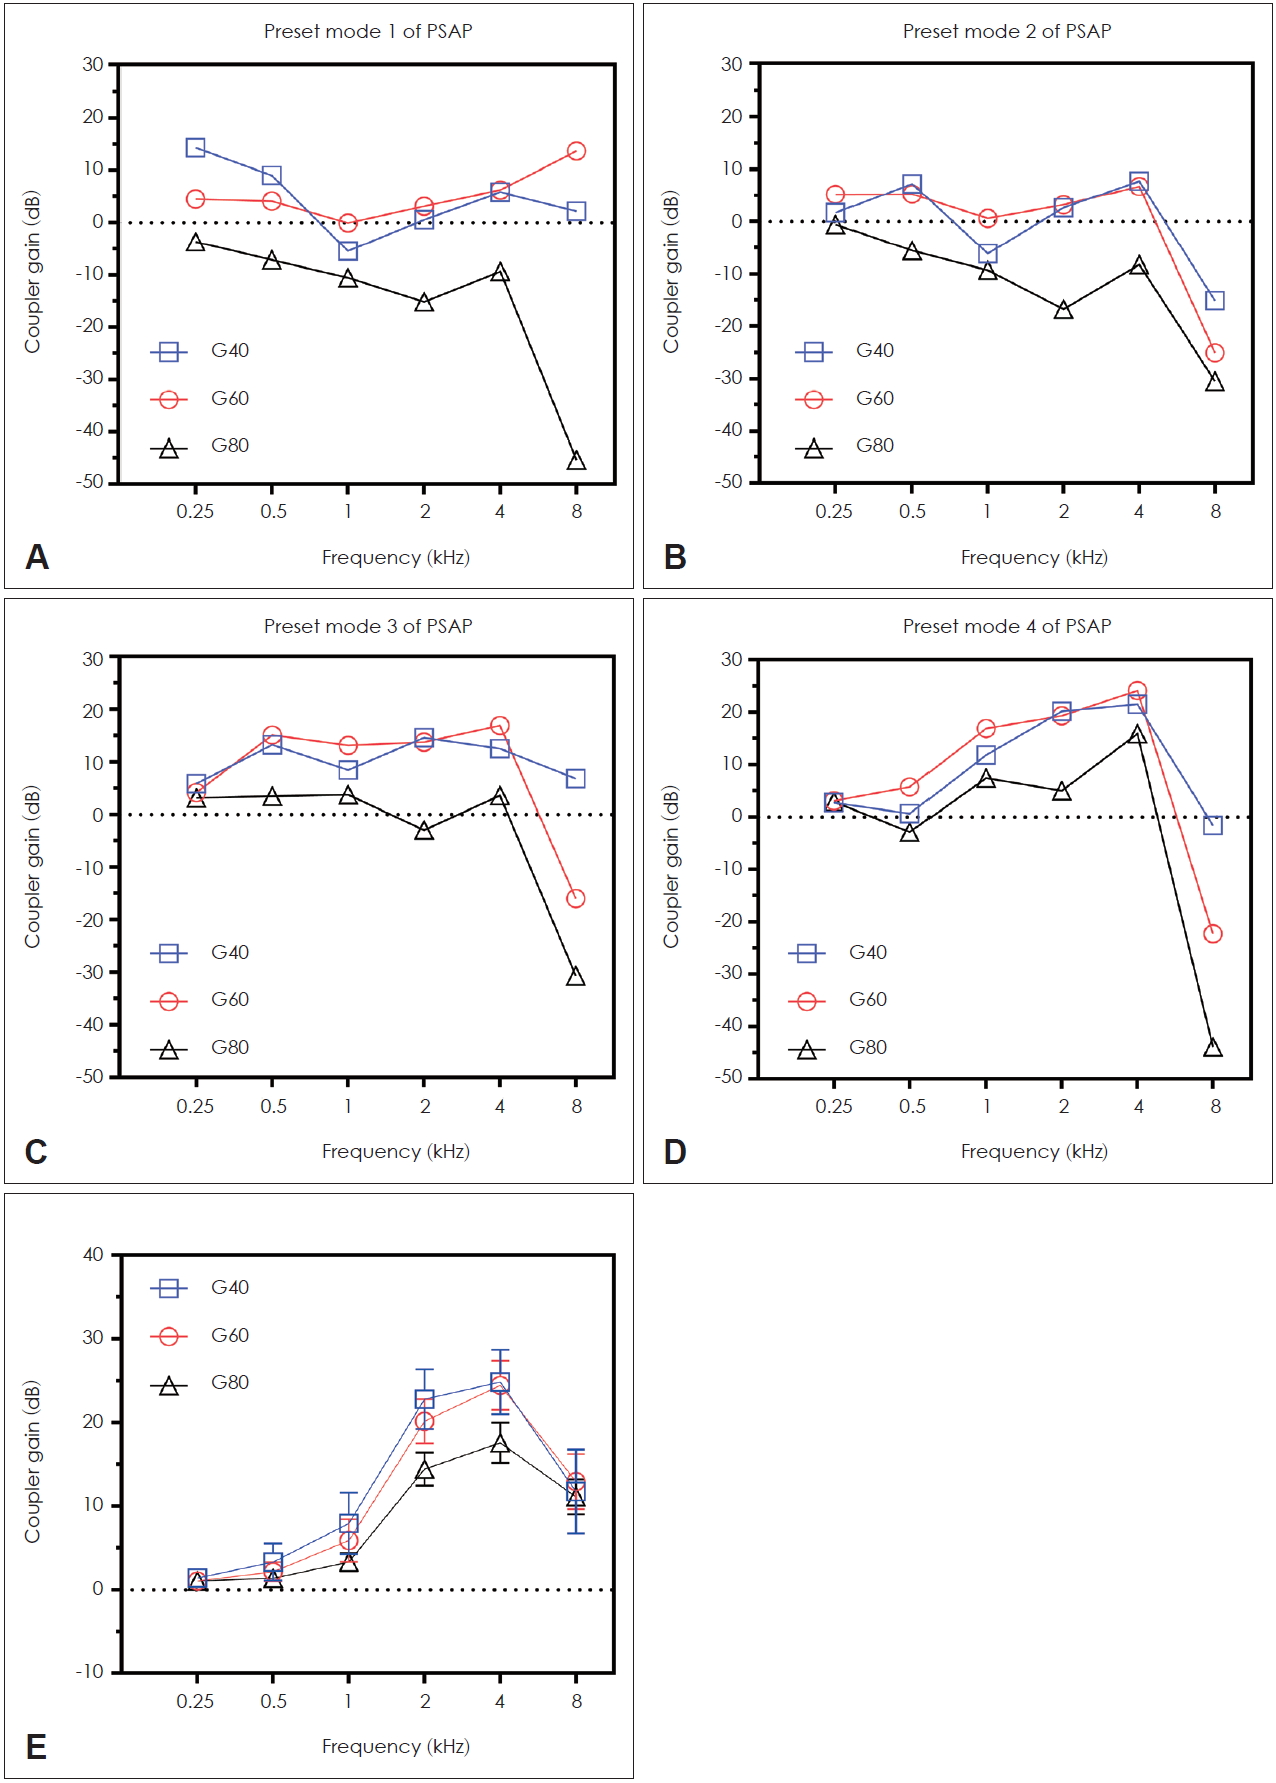
Coupler gains of personal sound amplification product (PSAP) and digital hearing aid (DHA). Coupler gains were measured at inputs of 40, 60, and 80 dB SPL (G40, G60, and G80). (A-D) Coupler gains of the PSAP according to four amplification preset mode. (E) Means with 95% confidence interval of the DHA’s coupler gains after fitting with National Acoustic Laboratories’ non-linear prescription, version 2.
Audiograms
Pure-tone thresholds (Fig. 2A), MCL (Fig. 2B), and WRS (Fig. 2C) were compared between unaided, HA-aided, and PSAP-aided conditions. There were significant differences in pure-tone thresholds among the three listening conditions at 0.5, 1, 2, 4, or 8 kHz (all p<0.01 in RM-ANOVA). Bonferronicorrected post hoc tests revealed the PSAP significantly improved hearing thresholds at 1, 2, or 4 kHz compared to the unaided condition (all p<0.01), and it provided significantly greater hearing gain at 2 and 4 kHz than did the HA (p=0.045 and <0.001, respectively). However, the PSAP provided no significant hearing gain at 8 kHz compared to the unaided condition (p=0.865). The HA provided a significant hearing gain at 8 kHz compared to the unaided (p<0.01) and PSAP-aided conditions (p= 0.006). Mean thresholds of MCL in unaided, HA-aided, and PSAP-aided conditions were 66 dB, 53 dB, and 55 dB, respectively. There were statistically significant differences in MCL depending on the listening condition [χ2(2)=33.343, p<0.001]. Both aided conditions significantly reduced the thresholds of MCL compared to the unaided condition (Z=-3.839, p<0.001 for HA-aided vs. unaided, Z=-3.765, p<0.001 for PSAP-aided vs. unaided). The thresholds of MCL in the HA was significantly lower than those of the PSAP (Z=-2.460, p=0.014). However, a Friedman test determined that there was no significant difference in WRSs depending on listening conditions [χ2 (2)=1.582, p=0.454].

Audiograms for the unaided, digital hearing aid (DHA)-aided, and personal sound amplification product (PSAP)-aided test conditions. Pure-tone thresholds (A) at each frequency (from 250 Hz to 8 kHz), most comfortable levels (MCL, B), and word recognition scores (WRS, C). The WRS was measured at MCL. Symbols indicate statistically significant differences in post hoc analysis (*for unaided vs. DHA-aided conditions, †for unaided vs. PSAP-aided conditions, ‡for DHA-aided vs. PSAP-aided conditions). PTA: pure-tone audiometry.
Speech intelligibility
Fig. 3A shows the SRTs obtained in a quiet condition. A repeated measures ANOVA determined that SRTs in a quiet condition differed significantly between listening conditions [F(2, 36)=19.674, p<0.001]. Bonferroni-corrected post hoc tests revealed that the HA elicited a slight reduction in SRTs in a quiet environment compared to the unaided condition (38.5±5.7 dB HL vs. 39.9±8.0 dB HL), although the difference was not significant (p=0.624). However, the SRTs in a quiet environment with PSAP were reduced to 34.1±5.9 dB HL, which was significantly different from the unaided (p<0.001) and HA-aided conditions (p<0.001).

Speech intelligibility under quiet (A) and noisy (B) test conditions. Speech intelligibility for the unaided digital hearing aid (DHA)-aided, and personal sound amplification product (PSAP)-aided test conditions. An asterisk (*) indicates a statistically significant difference in post hoc analysis. SRT: speech reception thresholds, SNR: speech to noise ratio.
Fig. 3B shows the SRTs in a noisy condition. A repeated measures ANOVA determined that SNR thresholds differed significantly between listening conditions [F(2, 36)=5.645, p=0.007]. However, Bonferroni-corrected post hoc tests revealed that the HA and PSAP devices failed to reduce SNR thresholds compared to the unaided condition (p=0.940 for HA-aided vs. unaided and p=0.160 for PSAP-aided vs. unaided conditions). The SNR threshold was lowest with PSAPs (mean SNR threshold of -2.4 dB HL), followed by the unaided condition (mean SNR threshold of -1.7 dB HL) and with HAs (mean SNR thresholds of -1.3 dB HL).
Speech quality and device preference
Fig. 4A shows the MOS of speech quality among the tested listening conditions. A Friedman test identified no significant differences in speech quality in a quiet environment [ARC; χ2(2)=1.000, p=0.607], speech distortion [SIG; χ2(2)=2.711, p=0.258], and noise intrusiveness [BAK; χ2(2)=0.897, p=0.639] depending on listening conditions. There was a significant difference in speech quality in a noisy environment depending on listening conditions [AVR; χ2(2)=7.849, p=0.020]. However, post hoc analysis with Wilcoxon signed-rank tests (significance level set at p<0.017 with a Bonferroni correction) revealed no significant differences between the results reported by unaided and HA-aided participants (Z=-1.278, p=0.201) or between the unaided and PSAP-aided participants (Z=-1.104, p=0.269). The highest MOS was reported by PSAP-aided participants (mean of 3.4), followed by unaided (mean of 3.0) and HA-aided participants (mean of 2.7). There was no statistically significant difference in speech quality as reported by PSAP- or HA-aided particiapnts when in the noisy testing environment (Z=-2.229, p=0.026).

Mean opinion scores (MOS) of speech quality and comparison mean opinion scores (CMOS) of device preference with 95% confidence intervals. The absolute category rating of speech quality (ARC) and speech signal distortion (SIG) in a quiet background, noise intrusiveness (BAK), and speech quality in a noisy background (OVR) are shown for the unaided, digital hearing aid (DHA), and personal sound amplification product (PSAP) conditions (A). The comparison mean opinion score for device preference in a quiet and noisy background are shown as box-and-whisker plots, except for a reading of 0, which indicates no device preference (B). Bars and error bars represent means and 95% confidence intervals. An asterisk (*) indicates a statistically significant difference in Friedman test.
Fig. 4B shows the participants’ subjective device preferences when tested in either the quiet or noisy environment. In the quiet environment, eight participants preferred an HA and eight participants preferred a PSAP. The remaining three participants had no preference in hearing device. The mean CMOS was -0.5, and in the quiet environment the participants preferred the PSAP to the HA. When tested in the noisy environment, eight participants preferred the HA and nine participants preferred the PSAP, and the mean CMOSs was 0.2.
Discussion
This study directly compared speech performance, sound quality, and preference between a PSAP and a basic HA among individuals with mild-to-moderate SNHL. Speech intelligibility in a quiet environment was significantly improved after wearing a PSAP, and this improvement was better than the result obtained with an HA. The PSAP also demonstrated significant improvement in the MCL in a quiet environment, similar to the MCL with an HA. However, speech intelligibility in a noisy environment was slightly improved after wearing a PSAP compared to the unaided condition (change from unaided, 0.7 dB; 95% CI, -1.1 to 0.4), which was not significant. Previously, Reed, et al. [15] reported that select PSAPs improved speech understanding in a noisy environment for those with mild-to-moderate hearing loss, but our results were insufficient to demonstrate the benefit of wearing a PSAP for improvement of speech intelligibility in a noisy environment. Subjective ratings of overall speech quality in the noisy testing condition also revealed that the PSAP elicited a slightly higher score compared to the unaided condition, but this was not significant.
Although the PSAP could not provide improvement in puretone thresholds at 8 kHz, it significantly improved hearing thresholds at 1, 2, and 4 kHz. The DHA fitted with a NAL-NL2 provided more functional gain at high frequency (8 kHz), but less functional gain at mid frequencies (2 and 4 kHz) than the PSAP in pure-tone audiometry. Generally, NAL-NL2 prescribes less overall gain and a higher compression ratio than NAL-NL1 for adults with mild or moderate hearing loss [20,25]. Also, NAL-NL2 prescribes relatively more gain across low and high frequencies and less gain across mid frequencies than NAL-NL1. Because the Korean language involves more energy across low frequencies and less energy across high frequencies than English, according to a long-term average speech spectrum comparison [26], the more functional gain at 2 and 4 kHz might contribute to better speech intelligibility in a quiet environment with a PSAP than an HA for Koreans with mild-to-moderate hearing loss. In this study, most participants (10 of 19) selected the PSAP mode with the smallest amount of amplification. These results suggest that the slight amplification provided by a PSAP could provide sufficient improvement in speech intelligibility in a quiet environment for individuals with mild-to-moderate hearing loss. However, this slight amplification was insufficient to improve speech intelligibility in a noisy environment. In addition, the PSAP did not provide a functional gain at 8 kHz, and this gain frequency response indicates that the PSAP was not suitable for high frequency hearing loss.
This study has several limitations. First, this study is limited by a lack of acclimatization and verification to maximize the benefit of HAs. Use of an HA rather degraded speech intelligibility in a noisy environment in 11 participants. Subjective ratings on speech quality in a noisy background also revealed that the HA elicited the lowest score among listening conditions (2.7±0.9 for DHA, 3.0±1.3 for unaided, and 3.4±1.0 for PSAP, OVR). The HA might produce speech distortion or background noise intrusiveness for new users, causing greater impairment of intelligibility when noise is mixed with speech [26]. Second, since only one PSAP and HA were used in the study, our results are limited to generalizations. Further research using a wider range of PSAPs and HAs is needed in order to better generalize the abilities of PSAPs relative to HAs. Third, the results of long-term PSAP and HA use in real life were not analyzed. Finally, all functions of the HA were disabled other than noise reduction, automatic directionality, and feedback cancellation.
Although our study has several limitations, the PSAP showed similar or better speech intelligibility in a quiet environment compared to an HA in individuals with mild-to-moderate SNHL. There was no significant subjective preference between the PSAP and HA. However, our results were not sufficient to demonstrate the benefit of PSAP on speech intelligibility in a noisy background. Therefore, this study suggests that PSAPs provide considerable improvement of speech intelligibility in a quiet environment and can be a good alternative to compensate for mild-to-moderate hearing loss; however, further research is required to verify these results.
Notes
Conflicts of interest
The authors have no financial conflicts of interest.
Authors’ contribution
Conceptualization: Sung Hwa Hong and Il Joon Moon. Data curation: Jinryoul Kim. Formal analysis: Ji Eun Choi. Methodology: Jinryoul Kim and Sung Hoon Yoon. Project administration: Sung Hwa Hong and Il Joon Moon. Resources: Sung Hwa Hong. and Il Joon Moon. Software: Jinryoul Kim and Sung Hoon Yoon. Supervision: Il Joon Moon. Validation: Ji Eun Choi Visualization: Ji Eun Choi. Writing—original drift: Ji Eun Choi. Writing—review & editing: Ji Eun Choi and Il Joon Moon.