Diagnostic Validity of Auditory Brainstem Response for the Initial Screening of Vestibular Schwannoma
Article information

Abstract
Background and Objectives
To investigate the diagnostic validity of auditory brainstem response (ABR) in the screening of vestibular schwannoma (VS).
Subjects and Methods
Forty patients diagnosed with VS using magnetic resonance imaging who had undergone ABR before treatment between 2005 and 2015 were included. ABR results were considered positive when findings met at least one of the following criteria: 1) absent evoked response, 2) desynchronization of waves other than wave I, 3) interpeak latency (IPL) between waves I and III >2.5 ms, 4) IPL between waves I and V >4.4 ms, 5) wave V interaural latency difference >0.2 ms, and 6) interaural difference in IPL between waves I and V >0.2 ms.
Results
The overall sensitivity of ABR was 85.0%. For tumors measuring <10 mm, the sensitivity of ABR was 66.7%, whereas it increased to 90.3% for tumors measuring >10 mm. The sensitivity of tumors confined to the internal acoustic canal was 73.3% compared with 100.0% for tumors confined to the cerebellopontine angle. In patients with serviceable hearing, the mean tumor size was 7.8±2.9 mm in patients with a normal ABR and 15.1±9.4 mm in patients with an abnormal ABR, indicating a significant difference (p<0.05).
Conclusions
ABR alone is insufficient for the screening of VS, bearing the risk of false-negative outcomes when examining small, intracanalicular tumors. However, ABR can be inexpensively applied for the screening of VS measuring >10 mm in patients with serviceable hearing, supporting the need for further active diagnostic and treatment modalities in clinical practice.
Introduction
In patients with recurrent, intractable hearing disturbance or vertigo despite adequate medication, the possibility of tumors of cerebellopontine angle (CPA) or internal auditory canal (IAC) should be investigated. The most common tumors at these sites are vestibular schwannomas (VSs), followed by CPA meningioma [1]. VSs are slow-growing, histologically benign tumors that are typically unilateral and sporadic; however, bilateral VSs have been reported in patients with neurofibromatosis type II (NF-II) [2]. Despite being low risk for malignant transformation, VS can result in gradual, irreversible sensorineural hearing loss over time and persisting disequilibrium and vertigo [3]. Therefore, early suspicion, detection, and management of VS could benefit patients by preventing further deterioration of their hearing and vestibular function.
Since the 1970s, the clinical efficacy of the auditory brainstem response (ABR) for the detection of VS has been compared with other diagnostic modalities [4-8]. Currently, gadolinium-enhanced temporal bone magnetic resonance imaging (Gd-TBMRI) is accepted as the “gold standard” method for the detection of VS [3,9]. However, its low cost efficiency causes many physicians to hesitate to recommend MR upon diagnosing idiopathic unilateral sensorineural hearing loss or persisting/recurrent vertigo despite adequate medication [4,10,11]. We, therefore aimed to investigate the diagnostic yield of abnormal ABR in patients with radiologically proven VS in a tertiary medical center setting, and thereby define the role of ABR in the detection of VS.
Subjects and Methods
Patients
This study was approved by the institutional review board (IRB) of Asan Medical Center (IRB approval no. 2016-1020). Patients diagnosed with VS by Gd-TBMRI between 2005 and 2015 at Asan Medical Center who had taken both ABR and Gd-TBMRI at the same period (<1-month time interval) before treatment were included. Exclusion criteria included patients who: were aged <10 years; had bilateral VS or NF-II; had their initial VS diagnosis in other medical facilities; lacked pre-treatment ABR; or had insufficient information on ABR latencies. Details on patient age and sex, and tumor location and size were retrospectively reviewed. Among patients with radiologically confirmed VS between 2005 and 2015, 43 patients had undergone ABR before any therapeutic management. Three patients were diagnosed with NF-II, showing bilateral VS on Gd-TBMRI. Therefore, 40 patients were included for the final analysis. Patients’ initial hearing levels were stratified according to the American Academy of Otolaryngology-Head and Neck Surgery (AAO-HNS) classification [12]. Patients were considered as ‘serviceable hearing group’ in AAO-HNS class A or B, whereas class C or D patients were considered as ‘non-serviceable hearing group’. In addition, the average value of pure tone threshold in 0.5, 1, 2, and 4 kHz (PTA4) was used to represent the pure tone hearing threshold of each patient.
ABR
Using the electro-diagnostic system Pathfinder MEGA (Nicolet Co, Madison, WI, USA), ABR was recorded for each individual. Stimuli were given as alternating clicking sounds of 90 dB SPL at a rate of 13 sounds per second until a total sum of 1,024 sound stimuli had been presented. Electrodes were placed on the scalp of the vertex and both mastoid processes. Results of the ABR were considered abnormal when they met at least one of the criteria listed in Table 1.

Diagnostic cut-off criterion for the detection of VS shown in the ABR
Gd-TBMRI
3T Gd-TBMRI was performed (Achieva; Philips Healthcare, Best, the Netherlands) with an 8-channel head coil. Coronal T1- and T2-weighted turbo spin-echo, axial 3D T2-weighted, pre- and post-contrast 3D-fluid-attenuated inversion recovery, and post-contrast T1-weighted images were reconstructed. GdDOTA (Dotarem; Guerbet, Aulnay-sous-Bois, France) at 0.2 mmoL/kg of body weight was used for contrast enhancement of TBMRI. The presence of VS was confirmed with GD-TBMRI by experienced radiologists. Fig. 1 shows VSs confined to the IAC, located only in the CPA, and extending to the IAC and CPA, respectively. The tumor’s long-axis diameter was measured and recorded. Macrotumor was defined with tumors with long axis diameter more than 10 mm, and microtumor was defined as tumors less than 10 mm. Patients were then categorized into three groups according to the long-axis diameter, based on the classification system suggested by Selesnick, et al. [13].
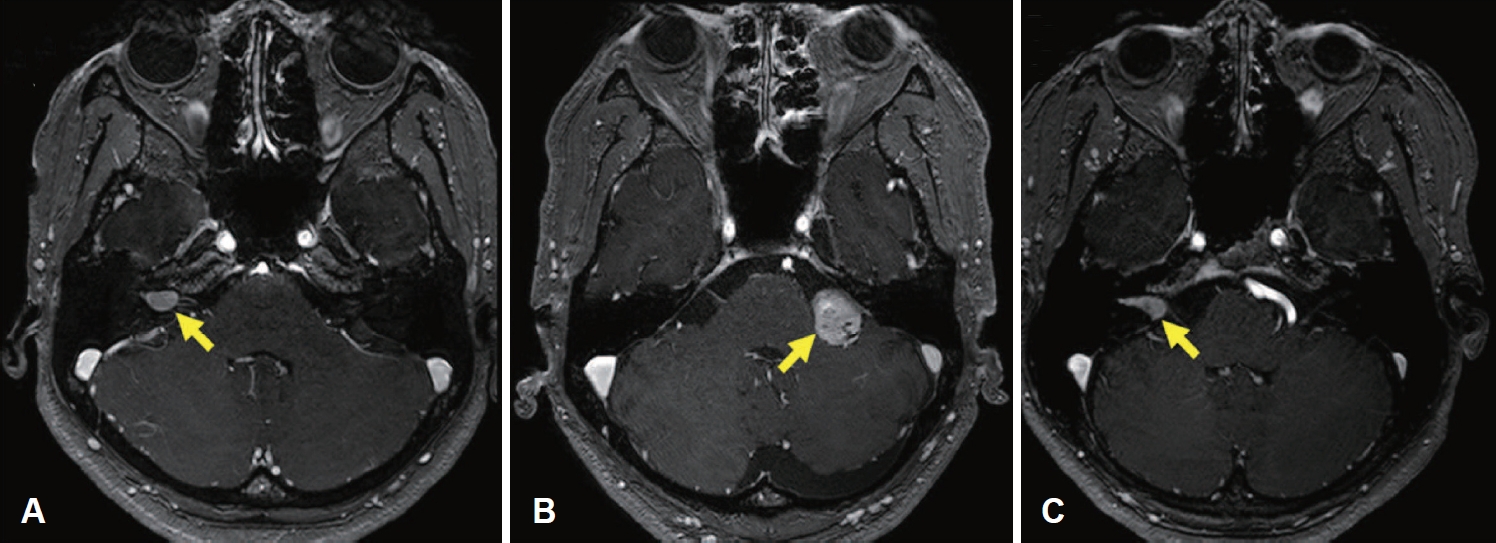
Classification of VS according to the tumor location shown in Gd-TBMRI. T1-weighted Gd-TBMRI of patients with VS classified by the tumor location. A: tumor confined to IAC. B: tumor confined to CPA. C: tumor extending from IAC to CPA. VS, vestibular schwannoma; Gd-TBMRI, gadolinium-enhanced temporal bone magnetic resonance imaging; IAC, internal auditory canal; CPA, cerebellopontine angle.
Statistical analysis
Statistical analyses were performed to analyze the differences in the detection rate using ABR in the diagnosis of VS. Fisher’s exact test was applied to identify differences according to the tumor location, and the linear-by-linear association (chi-square test for trend) was used to analyze differences according to tumor size and deterioration level of the initial hearing. The Student’s t-test or Mann-Whitney test were used to observe differences in tumor size, pure tone audiometry (PTA), and word recognition score (WRS) according to the presence of abnormal ABR findings, upon considering the normal distribution and number of sample size. All statistical analyses were performed using IBM SPSS software version 23.0 (IBM Corp., Armonk, NY, USA).
Results
Patient clinical and demographic data are presented in Table 2. The mean age was 50.4 years (range 12-78), and the male-to-female ratio was 2:1. The mean long-axis tumor diameter measured on Gd-TBMRI was 16.4 mm (range 4-46), with 15 cases (37.5%) confined to the IAC. The average PTA4 was a mean value and a standard deviation (SD) of 45.7±32.7 dB HL, with a mean WRS and SD of 69.3±36.9%. Patients with serviceable hearing were observed in 24 (60.0%) cases.
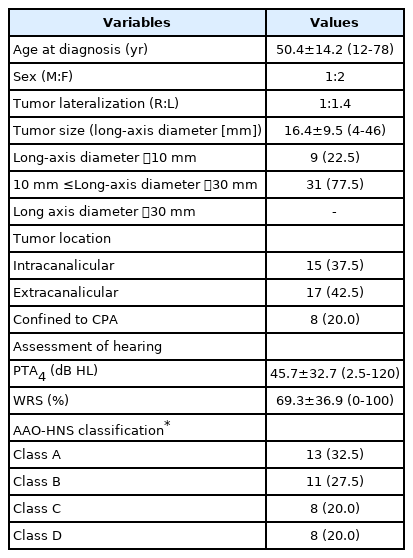
Clinical and demographical characteristics (n=40)
Overall sensitivity of ABR for the detection of VS was 85.0%. Six patients (15.0%) were classified as normal according to the ABR criteria shown in Table 1. In patients who showed an abnormal ABR waveform pattern, no response was noted in 16 patients (40.0%) at 90 dB SPL (Fig. 2A), five patients (12.5%) had only wave V present (Fig. 2B), one patient (2.5%) showed the absence of wave I (Fig. 2C), and one patient (2.5%) with the absence of wave V (Fig. 2D).
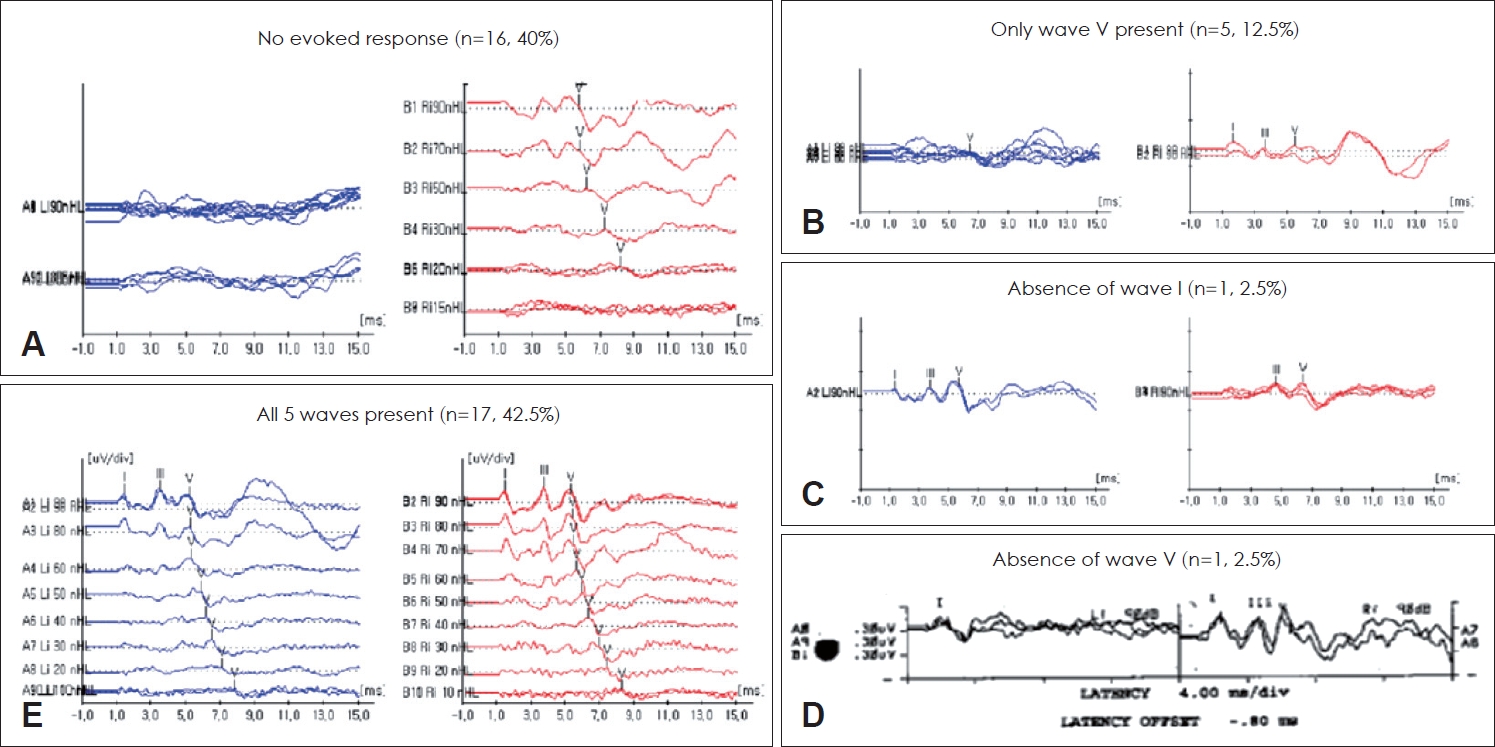
Various ABR waveform patterns shown in patients with VS (n=40). Five different patterns shown in the waveform of the ABR in 40 patients with VS confirmed with Gd-TBMRI. A: No evoked response although 90 dB SPL stimuli were given. B-D: Partial absence of waves I or V. E: All five waveforms preserved. ABR, auditory brainstem response; VS, vestibular schwannoma; Gd-TBMRI, gadolinium-enhanced temporal bone magnetic resonance imaging.
Preservation of all five waves was observed in 17 (42.5%) of 40 patients (Fig. 2E), and 11 patients (32.4%) were assessed as having an abnormal ABR according to the diagnostic criteria using the interpeak latency and the intraaural differences. The highest VS sensitivity occurred when intraaural latency differences between wave I and V were more than 0.2 ms (47.1%) (Table 3). Tumor size, ratio of micro to macro-tumors, and patients’ hearing ability in each six cut-off diagnostic criterion for the detection of VS were described in Table 3.

Six cut-off criterion to determine abnormal ABR findings among patients confirmed with VS on Gd-TBMRI (n=40)
Tumor size was significantly smaller (8.7±3.3 mm) in patients with normal ABR than in patients with abnormal ABR (Table 4). Although not statistically significant, the lowest sensitivity was detected in intracanalicular VS and tumors smaller than 10 mm in long-axis diameter (73.3% and 66.7%, respectively) compared with VS confined to CPA and tumors greater than 30 mm in long-axis diameter, both revealing sensitivity of 100.0%. The average of pure tone thresholds was higher in patients with abnormal ABR (48.1±32.9 dB HL) than patients with normal ABR (27.9±20.5 dB HL), although the difference was not statistically significant between the two groups. There was no significant difference in sensitivity between AAO-HNS Class D and Class A (100% and 76.9%, respectively). However, the mean WRS of patients with normal ABR (98.0%) was statistically different from patients with abnormal ABR (66.1%) (p=0.027).

Sensitivity of ABR upon diagnosis of VS by tumor characteristics and initial hearing (n=40)
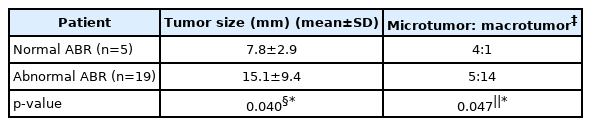
In 24 VS patients who had serviceable hearing (AAO-HNS class A or B), 19 patients showed abnormal ABR, showing sensitivity of 79.2 % (Table 5). The mean tumor size of abnormal ABR patient group showed 15.1±9.4 mm, showing a significant difference with the normal ABR VS patients (p=0.040). The portion of macrotumor showed 20% in the normal ABR group, whereas 73.7% patients had macrotumor in the abnormal ABR group, showing a significant difference (p=0.047).
Discussion
With the emergence of Gd-TBMRI in the 1980s, early detection of small VS larger than 3 mm had become possible, thereby making Gd-TBMRI the gold standard modality for the diagnosis of VS [13]. In addition, the importance of early detection of VS before the onset of severe, irreversible symptoms such as profound hearing loss, vertigo, and facial palsy has been discussed by many researchers over recent decades [2,3,14].
The management of VSs has become more conservative over time, with strategies including wait-and-scan becoming widely practiced. However, surgeons should bear in mind that certain patients could be salvaged with early VS treatments such as microsurgical resection and radiosurgery [3,15]. Early detection of VSs allows for more comprehensive therapeutic options to be available for patients, which would not be possible in cases of missed or delayed diagnosis. Therefore, a need for precise diagnosis of symptomatic patients with VS is essential.
Historically, several diagnostic modalities outside of Gd-TBMRI have been suggested to detect retrocochlear pathology. Kanzaki, et al. [7] observed a poor WRS of 36.7%, and a low WRS, despite preserved PTA threshold, in patients with VS. Jerger, et al. [6] additionally reported a 13% sensitivity of speech reception threshold (SRT) in patients with VS, whereas other researchers reported a sensitivity of 77% [7]. Godey, et al. [16] noted 84% sensitivity of SRT and 86% sensitivity of caloric vestibular response (CVR), totaling up to 98% sensitivity when all three SRT, CVR, ABR are used in combination for the detection of VS.
A recent meta-analysis reported that ABR shows an overall sensitivity of over 93% and specificity of over 82% [17]. The abnormality of ABR for the detection of VS was assessed with the presence of disrupted waveform and the interpeak and intraaural latency differences in all of the previous studies, with a minor variation in each study [9,18]. Chandrasekhar, et al. [5] highlighted the correlation between the size of VS with a diagnostic yield of ABR, showing 100% sensitivity in VS larger than 30 mm, whereas 83.1% sensitivity was obtained in VS smaller than 10 mm. However, Wilson, et al. [8] have shown 4% and 33% false-negative predictability of ABR in extracanalicular and intracanalicular VS, respectively. These data align with our findings, which show an overall sensitivity of 85.0%; the lowest sensitivity was found in small, intracanalicular VS (66.7%-73.3%) and the highest sensitivity in large VS confined to the CPA (100.0%).
Our results showed the highest sensitivity when the interaural latency difference of wave V >0.2 ms and the interaural difference of interpeak latency between wave I and V >0.2 ms was used (43.8% and 47.1%, respectively). In previous articles, the sensitivity of these two criteria showed a range of 66%-97% [15]; however, imaging techniques were not universalized at their time of publication (1990s). Therefore, an early detection rate could be much lower than in our study, determined as 90% of extracanalicular VS, with a mean size of 26 mm according to Godey, et al. [16]. In our data, 37.5% of patients had an intracanalicular VS, with an average tumor size of 16.4 mm, which potentially explains the difference in the sensitivity of ABR between the previous studies and our own.
Grimes and Schulz [19] and Shickle and Chadwick [20] proposed a set of criteria that would qualify a diagnostic modality with good validity in screening for a specific disease: 1) the test should be performed with ease; 2) the test should have a high cost–benefit ratio; 3) the disease should be detected easily in the early stage; 4) full recovery of the disease should be expected with early detection, and 5) the sensitivity of the test should have a high yield in the majority of the patients. The ABR is an easy, non-invasive, relatively inexpensive diagnostic tool for the detection of VS, particular for those that are large and extracanalicular. Denmark and India had previously omitted ABR at VS screening to reduce expenditure (40,000 EURO/year; 1,200 USD/patient, respectively) [11,21]. In South Korea, the cost for the Gd-TBMRI in 2017 was 830,000 Korean Won (approx. 740.41 USD), compared with 128,076 Korean Won (approx. 114.25 USD) for ABR threshold test, and less than 50,000 Korean Won (approx. 44.60 USD) for the ABR with bilateral 90 dBnHL click stimuli for the screening of VS. Approximately, more than 700 USD per every patient when ABR with 90 dBnHL click stimuli replaced Gd-TBMRI at VS screening.
As mentioned in many previous studies [22-24], patients with confirmed VS are often carefully observed over time, due to low rate of malignant transformation, slow growth, and life-threatening complication. Especially in micro-VS patients with serviceable hearing, treatment of VS with surgery of gammaknife radiosurgery bears the risk of hearing deterioration. Moreover, these treatment modality possesses the risk for facial palsy and vestibular dysfunction, which are two very rare clinical findings in the natural course of VS. Therefore, it would be important to detect the micro to macro-transformation of VS in the clinical practice. Our data show low sensitivity of ABR in the serviceable hearing group (AAO-HNS class A or B) (76.9% and 81.8%, respectively), compared with nonserviceable hearing group, showing 100.0% sensitivity. However, it should be noticed that in serviceable hearing group, the portion of macrotumor was significantly higher in patients with abnormal ABR findings then patients with normal ABR findings. These results support ABR may aid in screening macrotumors in patients with serviceable hearing, thereby providing an adequate timing for surgical intervention.
To our knowledge, no published studies have previously reported on the diagnostic validity of ABR for the screening of VS considering the patient’s initial hearing status with tumor size. Although our data propose an incongruity of ABR in VS screening in a linear fashion with previous studies, our study bears some limitations: 1) ABR was conducted in a limited number of patients due to the retrospective nature of the study, and 2) the information on patients who had taken ABR without radiological evidence of VS is lacking. Therefore, the specificity and cost–benefit analysis could not be performed.
Our findings support ABR as a valuable tool for the detection of large, extracanalicular tumors; however, is runs a risk for false-negative results in small, intracanalicular tumors. Therefore, Gd-TBMRI should remain as the gold standard diagnostic modality in VS screenings. However, in patients with preserved hearing, ABR may act as a cost-effective screening modality to detect large VS, enabling the physician to recommend a Gd-TBMRI along with more active treatment plan.
Acknowledgements
The authors have no acknowledgments to disclose.
Notes
Conflicts of interest
The authors have no financial conflicts of interest.
Author Contributions
Conceptualization: Marn Joon Park, Woo Seok Kang. Data curation: all authors. Formal analysis: Marn Joon Park, Woo Seok Kang. Investigation: Marn Joon Park, Woo Seok Kang. Methodology: Marn Joon Park, Woo Seok Kang. Project administration: Marn Joon Park, Woo Seok Kang. Software: Marn Joon Park. Supervision: Woo Seok Kang. Validation: all authors. Visualization: Marn Joon Park. Writing—original draft: Marn Joon Park, Woo Seok Kang. Writing—review & editing: Marn Joon Park, Woo Seok Kang. Approval of final manuscript: all authors.