Relationship Between Temporal Pattern Perception Test and Mismatch Negativity in Children With Auditory Processing Disorder and Dyslexia
Article information

Abstract
Background and Objectives
Mismatch negativity (MMN) is an objective test for assessing auditory function. The central auditory nervous system processes different stimuli in various ways. This can be assessed using MMN elicited with different stimuli in an “oddball” paradigm. This study evaluated temporal ordering skills using MMN with different durations of stimuli. This study aimed to determine the correlation between the results of the behavioral duration pattern test (DPT) with MMN in typically developing children versus children with dyslexia and auditory processing disorder (APD).
Subjects and Methods
Two groups of children participated in the study. The experimental group included 16 children with APD and dyslexia who had scored below the age-matched scores in the DPT. The control group consisted of 16 typically developing children with age-matched scores in the DPT. MMN was elicited using the same stimuli (250 ms and 500 ms) as that of the DPT in both groups. MMN latency, MMN amplitude, and area under the curve were measured in both groups.
Results
Compared to the control group, children with APD and dyslexia showed increased MMN latency, reduced amplitude, and decreased area under the curve. There was a low correlation (r= -0.293, p<0.05) between MMN latency and DPT scores. The correlation between MMN amplitude and DPT scores was moderate (0.472, p<0.001). Furthermore, a strong correlation (0.536, p<0.001) between area under the curve and DPT scores was demonstrated.
Conclusions
MMN amplitude and MMN area under the curve could serve as valid indicators during assessment of temporal ordering in children with APD and dyslexia.
Introduction
Auditory processing is defined as the ability of an individual with normal hearing sensitivity to understand and interpret the sound stimuli that are present in the environment [1]. There are various auditory processing abilities such as auditory perception in degraded and competing background noise, binaural integration and temporal related processing and auditory discrimination that are listed by American Speech and Hearing Association. Any difficulties in the above-mentioned processing abilities will result in auditory processing disorder (APD) [2].
Dyslexia is defined as a specific learning disability that is neurobiological in origin. It is characterized by the difficulties with fluent word recognition and poor phonological awareness of poor spelling [3].
Temporal processing is important process that helps in speech perception. Tallal, et al. [4] mentioned that children with poor temporal processing skills have difficulties in understanding the fast rate of speech, discrimination skills, intonation, stress, producing coordinated movements, playing a musical instrument, working memory, speech recognition and production. According to Shinn [5], temporal processing may be categorized as four sub-processes including: temporal resolution or discrimination, temporal ordering or sequencing, temporal integration or summation, and temporal masking. Gap detection test assesses the temporal resolution ability. Duration pattern test (DPT) and frequency pattern test assess the temporal pattern perception or temporal ordering ability of the individual [6,7].
Prevalence of APD and temporal processing difficulty in children with LD are reported to be high. Kumar and Nagarajan [8] found out that 20 (55%) out of 36 children diagnosed with dyslexia between 7 and 15 years were identified to have APD. Among them, 47% of them exhibited difficulty in temporal processing test. According to Dawes, et al. [9], 12 out of 22 (54%) children with APD has reported to have met the diagnostic criteria of dyslexia. Casini, et al. [10] reported that children with dyslexia have temporal processing difficulty in auditory as well visual modality.
Early diagnosis of children with APD can help in early intervention. Traditionally, APD is diagnosed using a battery of behavioral tests. However, Musiek [11] has reported that the behavioral tests can be administered only for children above 7 years. In addition, results of these behavioral tests and certain electrophysiological test are affected by various factors such as speech language ability, cognition, and auditory maturation.
Various studies have tried to find the implication of electrophysiological tests in assessment of APD [12-15]. Several researchers measured event related poentials such as cortical auditory evoked potential (CAEP), mismatch negativity (MMN), P300 in children with APD to see if it can be used to assess auditory processing skills. Koravand, et al. [12] found prolongation of P2 latency and reduction of P2 amplitude in children with APD. The authors also have used non-verbal (1 kHz and 2 kHz) and verbal stimuli (/ba/ and /da/) to measure MMN and found no significant differences in MMN amplitude and latency between APD and non-APD group.
Jirsa and Clontz [13] used P300 to study auditory processing difficulties in children with APD and control group. The results indicated that the latencies of N1, P2, and P300 components were significantly increased and amplitude of P300 was significantly decreased in APD group compare to control group. The authors suggested that P300 can be used to evaluate children with auditory processing difficulties. However, P300 is affected by the attention and memory level of children and cannot be elicited reliability in young children.
The most researchers choose MMN to study auditory processing, as it does not require attention. Näätänen, et al. [14] suggested that MMN might serves as an effective objective tool in the assessment of auditory processing in children with APD. The most important feature of MMN is that it is not affected by attention, cognition, and maturation. In addition, it helps in understanding the neurophysiology and the brain processes of central auditory processing. Garrido, et al. [15] stated that MMN is a negative component of the event-related potential that is seen at around 100-300 ms from the onset of stimuli. Several authors reported that MMN can be elicited with durational difference of auditory stimuli [16-19]. The MMN elicited with temporal parameter differences in auditory stimuli using “oddball” paradigm would reflect the underline physiology of temporal process [20].
Liasis, et al. [21] measured MMN elicited using speech stimuli in APD and control group. The authors observed no significant differences in MMN amplitude and latency between the groups. Similar finding was reported by Roggia and Colares [22]. The authors used nonverbal stimuli consist of frequency differences (750 Hz and 1,000 Hz), duration differences (100 ms and 50 ms) to measure MMN. Earlier studies have reported deviant MMN findings in children with dyslexia. Schulte-Körne, et al. [23] compared MMN results using verbal (yday & Ybay) and nonverbal stimuli (pure tones) in children with dyslexia and control. There was no significant difference in MMN elicited using nonverbal stimuli, but reduced MMN amplitude is seen using verbal stimuli between them.
Need
Electrophysiological tests help to identify the underlying physiology of the auditory processing. However, most of studies have shown inconclusive results in assessing auditory processing difficulties in APD children. This could be because all previous mentioned studies [12,21,22] have taken only MMN latency and amplitude into consideration. Thus, present study includes MMN area under curve in the MMN measures. And also, all above mentioned studies have used different stimuli for behavioral auditory processing assessment and MMN. These differences in stimuli could have also contributed to the differences in the results. Thus, the present study has used same stimuli (500 ms and 250 ms at 1 kHz) of DPT for eliciting MMN. This is done to see if MMN can be to use study auditory temporal ordering skills more effectively. And also, very few studies [24] have tried to find the correlation between electrophysiological responses with behavioral auditory processing testing in children with APD. Hence, the present study used same stimuli as that of DPT in MMN to see whether correlation can be improved. Majority of the study conducted in the past included either APD or dyslexia to study temporal processing. Those studies have not ruled out the presence of one disorder over others while selecting study group as most often both disorder of dyslexia and APD coexist. The present study included study group of children having both APD and dyslexia group. It was very difficult to find isolated APD in school going children. So, the present study involves children with dyslexia and APD as participants.
The primary objective of this study was to find the relationship between DPT and MMN in children with APD with dyslexia and the control group. The secondary objective was to compare MMN between APD with dyslexia and the control group and determine the correlation between DPT and MMN test in APD with dyslexia and the control group.
Subjects and Methods
This study was approved by the Ethics Committee of Sri Ramachandra Institute of Higher Education and Research (Reference number: CSP/18/APR/68/120). The participants were explained about the purpose of the study and written consent was taken from the parent/caretaker prior to the participation of the child in the study.
Subjects
We selected subjects for a case-control study. Two groups of children participated in the study. Group 1 included a control group of 16 typically developing children. These children had age- and gender-matched scores in the DPT test. Group 1 children were selected from a mainstream school with English as a medium of education. Group 2 included 16 children with APD and dyslexia whose scores were not adequate for their expected age and gender norms in DPT. Children in the APD with dyslexia group were selected from a special school for children with dyslexia who had English as a medium of education. All participants in APD with dyslexia were also diagnosed to have dyslexia based on Dyslexia Screening Tool-Junior (India version) and National Institute of Mental Health and Neuroscience (NIMHANS) Specific Learning Disability tool.
All participants in the control group had normal auditory processing as per APD diagnostic test battery. Details of APD diagnostic test battery is given in procedure. It was ensured that they did not have dyslexia as per on Dyslexia Screening ToolJunior (India version) and NIMHANS Specific Learning Disability tool.
Participants in control and experimental group had normal hearing sensitivity as per pure tone thresholds less than 15 dB HL at octave frequencies between 250 Hz and 8,000 Hz. Normal speech identification scores of more than 90% were ensured using phonetically balanced word list in English by Kacker and Basavaraj [25]. All of them had type ‘A’ tympanogram and presence of ipsilateral and contralateral reflexes indicating normal middle ear functioning. Age adequate language function in both groups were assessed using assessment of language development checklist [26]. None of them in both groups had complaints of psychological, neurological problems as revealed by Stanford-Binet Test. The age range of children in both groups were between 8 to 15 years. The mean age of the control group was 11.3 years with standard deviation of 3.11 years and APD group was 12.7 years with standard deviation of 3.8 years. There were 10 males and 6 females in each group.
Test environment
Detailed audiological evaluations were carried out in a sound-treated room with ambient noise within permissible limits as per ANSI S3.1 (1999).
Instrumentation
A preliminary audiological evaluation and diagnostic assessment of APD were carried out using the audiometer, Piano Inventis (SN: AU1CE15102619; Padova, Italy) with TDH39 headphone. MMN was recorded using the Intelligent Hearing System (SN: IHS4873; Miami, FL, USA).
Test procedures
A. Recruiting of participants in the APD with dyslexia and control group
The procedure involved administration of series of behavioral and electrophysiological tests in APD with dyslexia and control group. CD version of Screening Test for Auditory Processing (STAP) developed by Yathiraj and Maggu [27] was administered on 54 children with dyslexia to find who are at risk for APD. STAP had four subsections which included the speech in noise test, dichotic consonant vowel (CV), gap detection, and auditory memory. As per author guidelines, children who obtained refer score in any one of the subsections are considered as at-risk for APD [27]. Of 56 children, 26 had a refer score on any one or more sub-sections on STAP. APD diagnostic test battery was administered for all 26 children with dyslexia. The APD test battery consisted of five subtests including the speech in noise test [28], dichotic CV test [29], gap detection test [30], DPT [31], and auditory memory and sequencing tests [28]. These tests assess auditory separation, binaural integration, temporal resolution, temporal pattern perception, and auditory memory and sequencing, respectively. The participants were diagnosed to have APD if they fail in any two or more of the above-mentioned tests as per APD diagnostic criteria recommended by Chermak and Musiek [32]. Of 26 children with dyslexia, 22 were diagnosed to have APD. Out of 22 children with dyslexia along with APD, only 16 children had below age adequate scores on DPT. Thus, 16 children were included in APD with dyslexia group. Other auditory processing difficulties in APD group were in heterogeneous in nature. Fourteen (87.5%) had difficulty in auditory memory and sequencing ability as per auditory memory and sequencing test. Thirteen (81.25%) of them had difficulty in auditory integration as per dichotic CV test. Poor auditory separation ability and temporal resolution ability were seen in 9 (56%) participants as per speech in noise and gap detection test. None of them received any formal treatment for APD prior to the study.
For the selection of control participants, Screening Checklist for Auditory Processing (SCAP) developed by Yathiraj and Mascarenhas [33] was administered to teachers of 100 mainstream school going children to assess who are at risk for APD. The results of SCAP were scored based on 2-point rating (Yes and No) scale on 12 questions. Children with a cut-off score of less than 6 were considered as pass and children with a score of more than 6 were termed as ‘at-risk’ for APD [34]. Out of 100 children, 88 children had scored less than 6. Out of 88 children, STAP were administered on randomly selected 25 children. All of them had pass score on STAP. Out of 25 children, 16 children who age and gender matched to APD group (10 males and 6 females) were selected as control group for the present study. Participants in the control group had an age adequate score in the DPT and other APD tests. An electrophysiological measure, MMN was carried out on all the 32 participants in both groups.
B. Duration pattern test
The DPT was administered using the CD version [31] of the test which was played using a computer. The output from the computer was routed through an audiometer and stimuli were presented through headphones. The signals were presented monaurally to each ear at 40 dBSL (ref. pure tone average). Each test item consists of three sets of stimuli with varying duration with an inter-stimuli interval of 200 ms. Long stimuli consisted of 1 kHz tone lasting for 500 ms and the duration of the short stimuli lasted for 250 ms at 1 kHz. The participants were instructed to verbally respond to the duration of the stimulus as ‘long’ and ‘short’ in the presented order (e.g., long long short). There are total of 30 stimuli for each ear. The responses which are repeated in same order were scored 1 and incorrect responses were scored as 0. Total correct responses were calculated. Few participants were tested in the right ear first and few participants were tested in the left ear first to eliminate ear effect.
The entire test duration for each participant for behavioral testing lasted approximately 4 hours. Breaks were given in between the testing to ensure that the participants attend to the test stimuli without getting distracted. The entire assessments were completed in two or three days by providing appointment for 2 hours in a day for some children.
C. Administration of MMN
MMN responses were elicited acoustically by presenting a standard and a deviant stimulus with varied duration (500 ms vs. 250 ms at 1 kHz). Same stimuli pair of DPT was used to record MMN to see whether MMN responses reflect the performance of DPT. During MMN recording, the participants were seated comfortably and watching a silent video to deviate the attention from stimuli. Non-inverting electrode was placed on Cz with reference to the inverting electrodes placed in A1 or A2. The ground electrode was placed on the lower forehead (Fpz). It was ensured that all the three recording electrodes had an absolute impedance of less than 3 kΩ and inter-electrode impedance of less than 2 kΩ.
Stimuli were presented monoaurally using an ER-3A insert phone with an intensity of 80 dBnHL. Pair of duration deviant stimuli (500 ms vs. 250 ms at 1 kHz) were presented in a pseudo randomized manner with a repetition rate of 1.1/s. Stimuli were presented in the oddball paradigm with the probability of standard and deviant stimulus being 80% and 20%, respectively. Recorded EEG was amplified by 25,000 and filtered using 1 Hz to 30 Hz band pass filter. The response was averaged for 250 sweeps from -100 ms to 500 ms. One channel was used to record the responses and the other channel was used to monitor ocular artifact. Thus, inverting and non-inverting electrodes were placed on the outer sides (beyond the outer canthus) of each eye to monitor the eye blinking artifact during the recording. Table 1 shows the stimulus and recording parameters used to measure MMN.
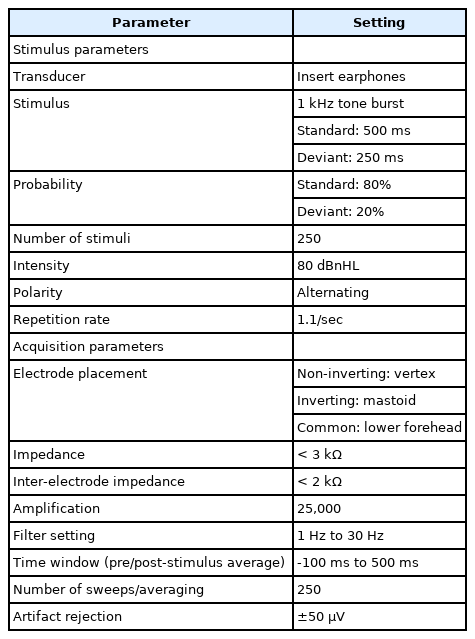
Stimulus and recording parameters for acquisition of MMN
The responses were checked based on the replicability. The cortical responses were obtained for standard and deviant stimuli. MMN responses were obtained by subtracting standard waveform from deviant waveform. From the subtracted waveform, the MMN latency, amplitude, and area under the curve were measured for each ear. The prominent replicable negative potential from 100 ms to 300 ms was marked as the MMN. Amplitude value from stable baseline values were measured as MMN amplitude. Area under the curve were calculated by marking MMN amplitude from negative peak to baseline. The system provides the value of area under the curve by µV · ms. The entire MMN test duration for both ears could be completed within 30 min.
Obtained waveforms were given to two different audiologists who had experience of 10 years in the area of evoked potentials. MMN measures of MMN latency, amplitude, and area where both examiners agreed were taken for final analysis. If there is a disagreement in marking of MMN measures, it was given to third examiner.
Data analysis
The obtained data on DPT and MMN measures were tabulated using Statistical Package for the Social Sciences software (version 16.0; SPSS Inc., Chicago, IL, USA). Normal distributions of data were assessed using Shapiro-Wilk test that indicated that the data of DPT and MMN followed normal distribution curve. Mean and standard deviation scores for DPT and MMN were calculated for both groups. DPT and MMN findings between ears were compared using paired t-test. These DPT and MMN between both groups were statistically compared using independent t-test. Pearson correlation was used to correlate DPT scores with the results of MMN in both groups. Suggestions by Cohen [35] have been used to define the level of correlation as follows: low, r=0.10-0.29; moderate, r=0.30-0.49; and strong, r=0.50-1.0.
Results
DPT between the control and the APD with dyslexia group
It can be observed from Table 2 that the mean DPT scores in the APD with dyslexia group were lower when compared to control group based on individual ear or both ears. Initially, paired t-test was carried out to find the difference in the DPT scores between the right (n=16 ears) and the left ear (n=16 ears) in APD with dyslexia group. Paired t-test showed that there was no significant difference (t=1.366, p=0.192) of DPT scores between ears. Thus, both ears (n=32 ears) were combined in the APD with dyslexia group for further statistical analysis. Similarly, ear difference DPT scores were not significant (t=0.428, p=0.675) in control group, so both ears (n=32 ears) were combined for in control group for further analysis. Independent t-test was carried out to compare the DPT scores between control and the APD with dyslexic group. The results indicated that DPT scores of children in APD with dyslexia group had significantly (t=12.19, p=0.001) reduced scores compared to controls.
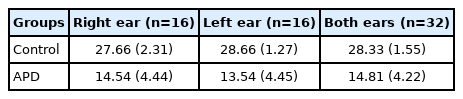
DPT percentage scores in control and APD group
Comparison of MMN between control and APD with dyslexia group
The obtained data from both groups were analyzed in terms of the MMN latency, amplitude, and area under the curve for each ear in both groups. Comparison between right and left ear of the control group revealed non-significant difference as regards latency (t=1.56, p=0.234), amplitude (t=2.34, p=0.114), and area (t=2.34, p=0.122). Hence, all these MMN measures of both ears (n=32 ears) were combined for control group. Comparison of data from right versus left ear of the APD with dyslexia group showed non-significant difference in the MMN latency (t=2.12, p=0.233), amplitude (t=1.87, p=0.112), and area (t=1.2, p=0.43). Data from both ears (n=32 ears) in APD with dyslexia group were also combined for further statistical analysis.
The mean and standard deviation values of MMN latency, amplitude, and area under the curve, p, t value in both groups are given in Table 3. The results indicated that the mean scores of MMN amplitude and area under the curve in the APD group were reduced compared to the control group. The MMN latency value was prolonged for children in the APD with dyslexia group compared to the control group. According to independent t-test, it was found that there was a significant difference in the MMN amplitude and area under the curve between APD and control group. MMN latency between groups was not significantly different.
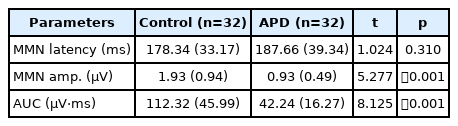
Comparison of MMN latency, amplitude, and AUC values in control and APD groups
Correlation between DPT and MMN in both groups
The correlation between DPT scores and MMN measures of the latency, amplitude, area under the curve was analyzed using Pearson correlation coefficient and is mentioned in Table 4. Results indicated that there was a significant low correlation between MMN latency and DPT scores. There was a moderate correlation of DPT with MMN amplitude and strong correlations of area under the curve measures with DPT scores.
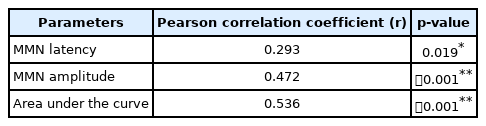
Correlation between DPT and MMN parameters in both groups
Grand average of MMN wave from in APD and control group is represented in Fig. 1. As it can be seen from Fig. 1, reduced amplitude and MMN area in APD with dyslexic group compare to control can be observed.
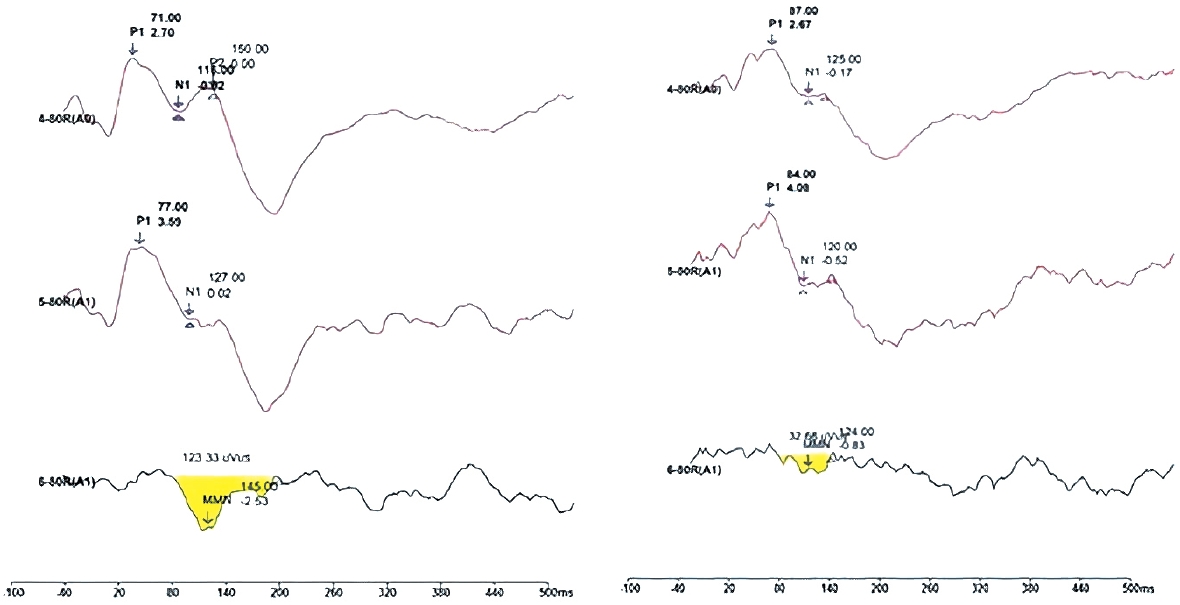
Grand average of mismatch negativity response in control (right panel) and experimental group (left panel).
Discussion
The results of the current study suggested that reduced DPT scores in children in APD group suggest difficulty in the temporal ordering skills. Sharma, et al. [36] also found that 82% of children who were diagnosed to have APD failed in pattern perception task bilaterally. Studies conducted on Indian children with dyslexia by Kumar and Nagarajan [8] reported that 47% of children who had APD have exhibited difficulty in temporal processing test. Muthuselvi and Yathiraj [34] stated that 15% of school-going children diagnosed with APD failed in temporal processing test.
This result implied that the only MMN amplitude and area under the curve values show significant differences between typically developing children and individuals with APD. This indicates that MMN amplitude and area under the curve can serve as an indicator for auditory processing skills, whereas, the MMN latency is not a significant indicator of integrity of temporal ordering skills. Several studies have shown MMN measures being affected in children with dyslexia and inconclusive results in children with APD. Various authors found that both MMN latency and amplitude are significant indicators in differentiating the performance of dyslexia from that of the control group [37-39].
The present study found the area under the curve value demarcated between the APD with dyslexia and the control group (42 µV and 112 µV). Similarly, Sharma, et al. [36] found reduced area of MMN in dyslexia using tonal stimuli. Thus, with the data obtained, the present study concluded that only MMN amplitude or area under the curve is an important indicator to assess auditory processing in children. Most of the MMN studies carried out in children with APD showed non-significant differences in MMN measures between APD and non-APD group. Koravand, et al. [12] reported that only CAEP N2 latency prolongation in children with APD and no differences in MMN between APD and non-APD group. Liasis, et al. [21] investigated MMN responses using speech stimuli of /ba/ and /da/ in school going children with suspected APD and typically developing normal children. The authors found no significant differences in MMN latency and peak amplitude between children with suspected APD and normal children. Roggia and Colares [22] found no significant differences in the latency or amplitude of MMN elicited using duration and frequency deviant between APD and control group. Individual differences in auditory process difficulties in the APD group and stimuli used to elicit MMN could have contributed to non-significant differences of MMN in APD. Deviant MMN measures in the present study could also be attributed to dyslexia components in the present study.
The present study results found a correlation between the DPT and MMN measures of amplitude and area using the same stimuli. Thus, it can be concluded that MMN amplitude and area can be used to study temporal ordering skills. Sharma, et al. [36] also found significantly poorer results in the auditory processing test battery which was correlated with smaller MMN area under the curve value in children with dyslexia using tone stimuli. Similarly, Kraus, et al. [40] have reported that children with APD had diminished ability to discriminate speech stimuli /da/ and /ga/ that was correlated with the diminished MMN amplitude for speech stimuli. Mattsson, et al. [24] found moderate correlations between P300 latency and amplitude with competing words, frequency patterns, duration patterns, and dichotic digits. Type of stimuli used to assess MMN also important aspects. MMN elicited using complex stimuli would be able to assess auditory processing more effectively when compared to simple stimuli variants. Use of MMN in the APD test battery adds valuable information and can be considered as supplementary tool in diagnosis of APD.
Limitation
The present study included children diagnosed with dyslexia and APD, it is very difficult to differentiate which disorder (learning disability or APD) is contributing to poor MMN results in them. This is to be considered in case MMN is used among either APD or dyslexia population independently in clinical situation.
Conclusion
The current study found that there is a correlation between the DPT and the MMN test using the same stimuli pair in both tests. Thus, MMN using durational differences in stimuli might assess the temporal pattern perception.
Acknowledgements
The authors would like to thank the Head of the Faculty of Audiology and Speech Language Pathology, Sri Ramachandra Institute of Higher Education for permitting us to carry out data collection.
Notes
Conflicts of interest
The authors have no financial conflicts of interest.
Author Contributions
Conceptualization: MuthuSelvi Thangaraj. Data curation: Roshan Shahinas Peer Mohammed Mohideen. Formal analysis: MuthuSelvi Thangaraj. Investigation: Roshan Shahinas Peer Mohammed Mohideen. Methodology: Roshan Shahinas Peer Mohammed Mohideen, MuthuSelvi Thangaraj. Project administration: Roshan Shahinas Peer Mohammed Mohideen. Resources: MuthuSelvi Thangaraj, Roshan Shahinas Peer Mohammed Mohideen. Supervision: MuthuSelvi Thangaraj. Validation: MuthuSelvi Thangaraj. Visualization: Roshan Shahinas Peer Mohammed Mohideen. Writing—original draft: Roshan Shahinas Peer Mohammed Mohideen. Writing—review & editing: MuthuSelvi Thangaraj. Approval of final manuscript: Roshan Shahinas Peer Mohammed Mohideen, MuthuSelvi Thangaraj.