Study on Effective Improvement of Mobile Phone Sound Quality in a Noise Environment for the Hearing-Impaired
Article information
Abstract
Background and Objectives
For the hearing-impaired population, quality of sound when listening to speech on mobile phone is often dissatisfactory. Even with a turning up the volume, they feel mobile speech unclear and desire the mobile sounds to be amplified as suited for the hearing characteristics. The purpose of this study was to estimate the appropriateness of NAL-NL1 fitting formula for the hearing-impaired mobile communication.
Materials and Methods
NAL-NL1 and a modified fitting formula (M-formula) were applied for sound amplification in consideration of individual hearing loss. Amplified speech material was presented for a word-recognition score (WRS) test in each subject. To simulate actual mobile phone sound, all speech material was filtered in 8 kHz low-pass filter and presented through a mobile phone to the subjects. Speech material was categorized into a speech-without-noise group and noisy speech group.
Results
Amplified sound with NAL-NL1 formula had a slightly better WRS than amplified speech with M-formula in speech-without-noise environments. However, in the noisy speech group, M-formula showed better WRS than NAL-NL1.
Conclusions
For a good speech-perception in mobile phones, more high-frequency speech components need to be provided, especially for noisy environments. This study showed the possibility that specified fitting strategies may be applied for mobile phones to improve hearing in various environments, as with hearing aids.
Introduction
With the development of modern science and medical technology, the average life-expectancy and ratio of aging population have increased, along with various geriatric illnesses having diversified. With the increasing aged population, presbycusis (a type of cumulative effects of aging on hearing) is emerging as a significant social concern and challenge.1,2) With the aging population, those affected by presbycusis will increase, and most of the concerned will be high-frequency hearing-impaired.
Patients of presbycusis with high-frequency impairment, with a light or moderate-severe hearing loss in the high frequency zone, tend to feel uncomfortable in daily life due to low voice-awareness and inaccurate meaning transfer.3) There is no specific treatment for presbycusis, and the patients with severe hearing-loss are being recommended hearing aids. The hearing-aid use is limited, as many patients complain of repulsion or discomfort.
With the widening mobile phone usage, the frequency and time-usage of mobile communication has increased. Presbycusis patients have difficulties with the speech quality in mobile phones. Human audible range is between 20 Hz to 20 kHz, and the vocal range is around 8 kHz. At this time, most mobile phones have 8000 Hz sampling rate in consideration of telecom infrastructure or data loss prevention. Most mobile phone speakers support sounds up to 4000 Hz. As a consequence, presbycusis patients who are impaired in the middle or high frequency zone show low speech-recognition scores. In order to solve the mobile voice-recognition difficulty, we have developed a fitting formula to improve the phone speech quality.
Materials and Methods
We applied the hearing-aid fitting formula to a mobile phone (SCH-M480, SAMSUNG, Korea) to provide the hearing-impaired with a more efficient speech-recognition through the sound quality improvement. Then, we conducted a hearing test for 6 normal-hearing adults and 6 presbycusis patients. The test was in the frequency of 250 Hz, 500 Hz, 1 kHz, 2 kHz, 4 kHz and 8 kHz. The normal-hearing adults were 28.5 years old on average, and the hearing-impaired were average 71.7 year old senior citizens (Table 1). The presbycusis patients had an average minimum audible of at least 30 dB without past experience of wearing hearing aids (Fig. 1, 2). We applied both the NAL-NL1fitting formula (one of the hearing-aid fitting formulae according to individual audiogram) and the improved adaptation method (modified fitting formula, M-formula), which was developed for the purpose of mobile phone voice improvement for both the hearing-adults and hearing-impaired. The formula application assessed the individual word-recognition score (WRS). M-formula was a modified NAL-NL1 fitting formula. For presbycusis patients with high-frequency loss, a gain in 4 kHz was adapted 5 dB, and a gain in 8 kHz was adapted 7 dB as compared to NAL-NL1.
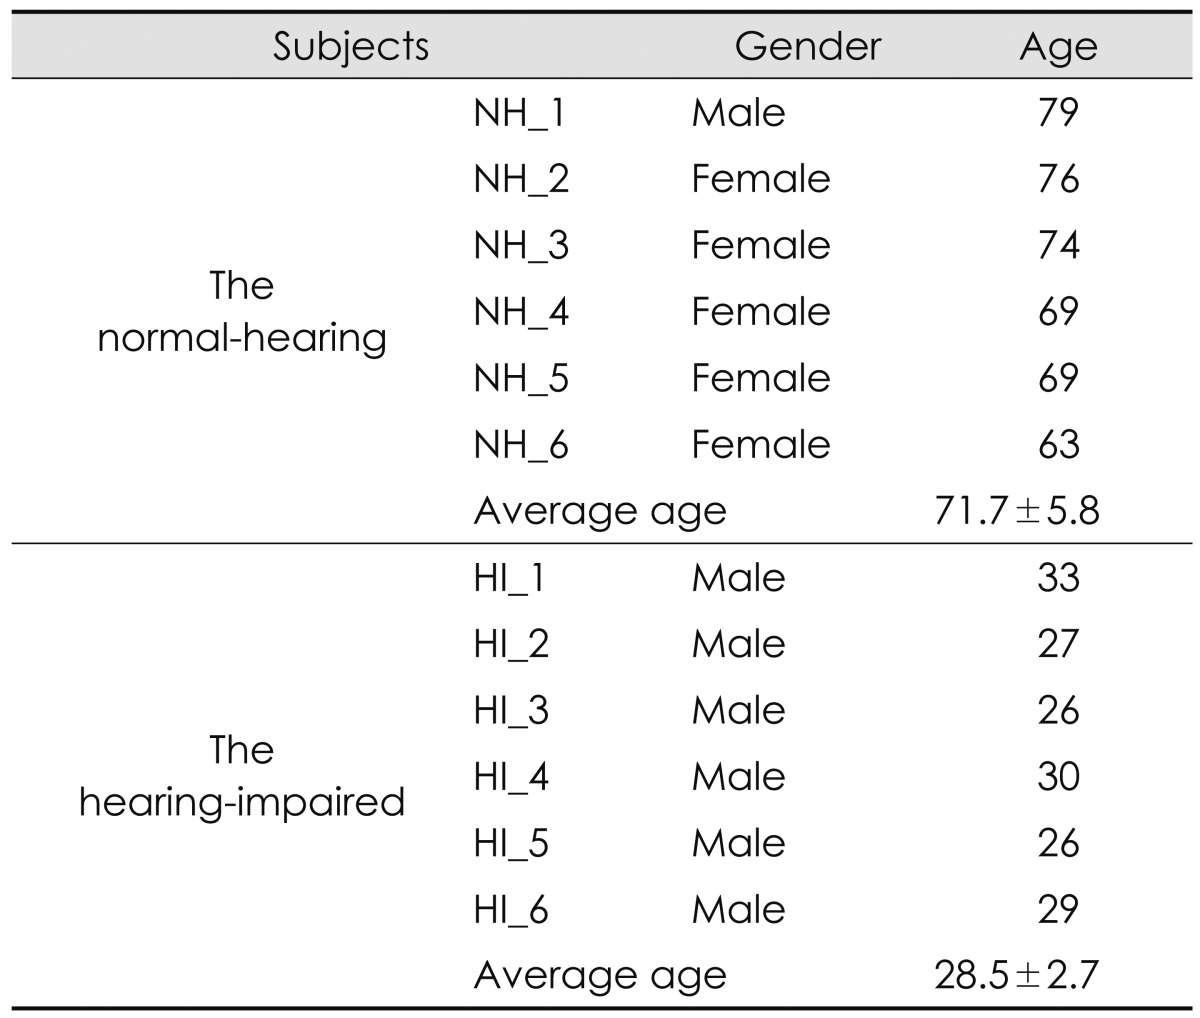
Information of subjects
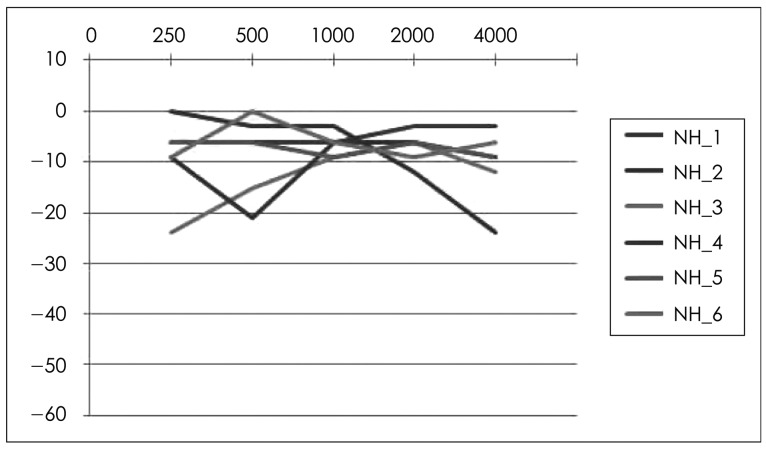
Hearing loss of the normal-hearing. Average age of six subjects is 28.5 years. NH: normal-hearing.
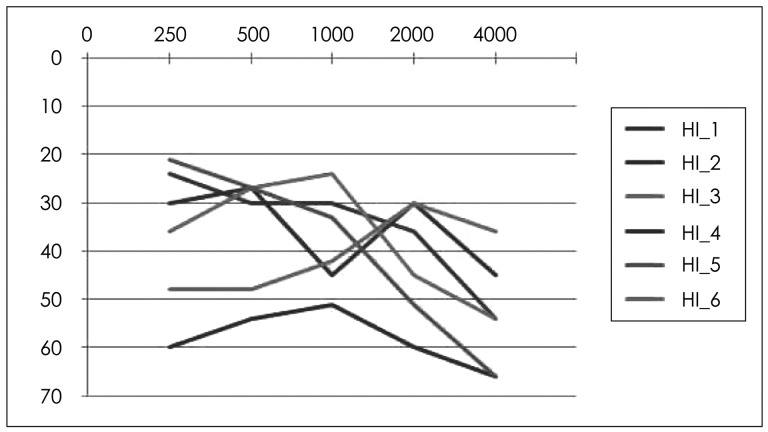
Hearing loss of the hearing-impaired. Average age of six subjects is 71.7 years (without a history of hearing-aid use). HI: hearing-impaired.
Regarding WRS, we let each subject hear 1 syllable word to assess the response ratio fairly, and each 1 syllable word was chosen from a test sound set (Korean standard-sentence list for adults) composed of familiar words in daily life. Test sounds from mobile phone were set at the most comfortable level for each subject. We used white noise (SNR=10 dB) to compare the results without noise with the results in noise environment for the speech discrimination score as depending on the environment. To equalize the test sound with the mobile phone sound quality, we put the sound through an 8 kHz low-pass filter and applied both the NAL-NL1 and M-formula, one of the improved fitting formulae to grant the appropriate amplification gain to individual audiogram.
Results
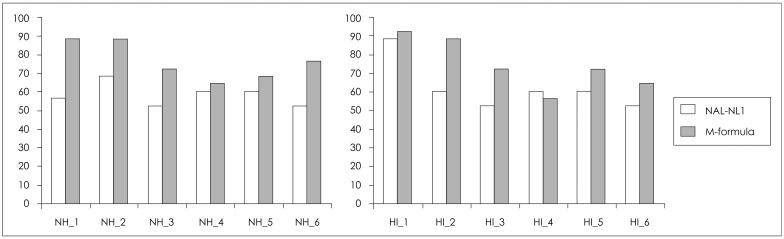
The graph shows the comparison results between NAL-NL1 and M-formula, depending on the hearing loss and noise for 12 subjects (Fig. 3, 4). To begin, we conducted WRS in a quite environment. The average score of 6 hearing adults was 89.3 points after NAL-NL1 application and 88.0 points after M-formula adaptation, indicating the former application to be approximately 1.3 point higher. In case of the hearing-impaired, NAL-NL1 application result value was 82.7 points, and M-formula application result value was 78.0 points, indicating the former to be 4.7 point higher (Fig. 5). In a white noise condition, NAL-NL1 adaptation result average score of hearing-adults was 58.0 points, and M-formula adaptation result average score was 76.0, indicating that the improved adaptation raised the score by 18 points. In case of the hearing-impaired, NAL-NL1 adaptation result was 62.0 points and the M-formula adaptation result was 74.0 points, 12 points higher than the former method (Fig. 6).

Result of WRS without noise. Result of NAL-NL1 is similar with M-formula or slightly higher than M-formula. WRS: word-recognition score, NH: normal-hearing, HI: hearing-impaired, M-formula: modified fitting formula.
Result of WRS with noise. Result of M-formula is higher than NAL-NL1. WRS: word-recognition score, NH: normal-hearing, HI: hearing-impaired, M-formula: modified fitting formula.
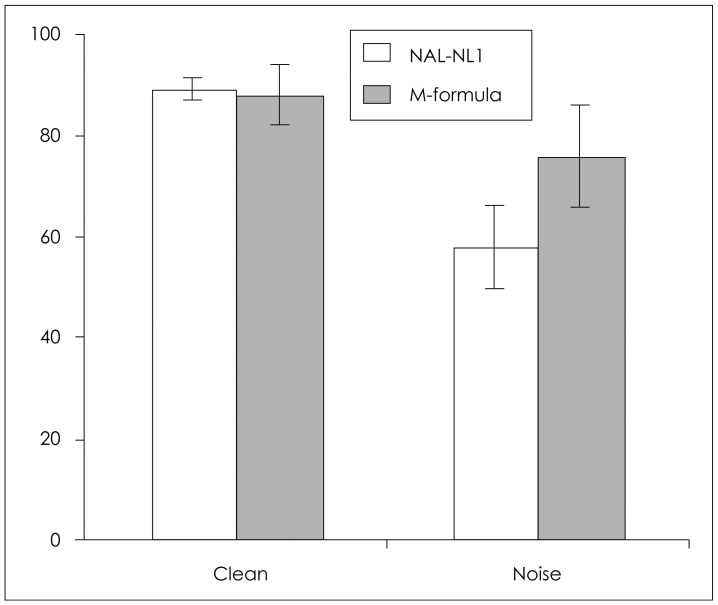
Result of WRS average for the normal-hearing in various environments. Result of M-formula is 1.3 point lower than NAL-NL1 without noise, but 18.0 higher than NAL-NL1. WRS: word-recognition score, M-formula: modified fitting formula.
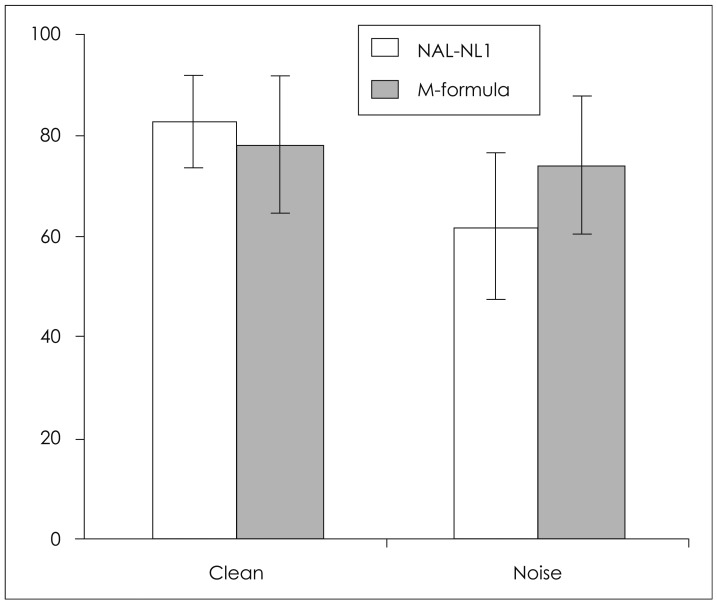
Result of WRS average for the hearing-impaired in various environments. Result of M-formula is 4.7 point lower than NAL-NL1 without noise, but 12.0 higher than NAL-NL1. WRS: word-recognition score, M-formula: modified fitting formula.
Discussion
The signal generated from a mobile phone is voice-signal transmitted through radio communication after being sampled at the frequency of 8 kHz. The generative sound of the voice signal is limited to 4 kHz under the sampling theory. Therefore, presbycusis patients have lower speech discrimination scores and WRS, and they cannot expect to improve the mobile phone sound quality by the phone volume control only. As a result, sound gain is necessary for the speech-quality improvement as depending on the individual degree of deafness. We applied the hearing-aid fitting formula used for the hearing aids for this research. The NAL-NL1 method, one of the conventional and popular hearing-aid fitting formula, amplifies each frequency based on the English language, and the M-formula adaptation method, an improved adaptation method, has been transformed to suit the features of the Korean language.4)
Korean and English differ in frequency analysis.5) According to the Long-Term Average Speech Spectrum comparison results of Korean and English, Korean is higher in energy level in the low frequency zone than English, and has less energy in the high frequency zone.6-8) Since consonants have lower energy and wider frequency zone than vowels,9) it may be seen that consonants may play a more important role in Korean speech than vowels.10) The amplitude gap between both languages was up to 13 dB in the low frequency zone and up to 9 dB in the high frequency zone (Fig. 7). It is assumed to have been caused by the distribution of consonants and vowels composing a chord and the speech length.11) On the basis of above findings, we developed an improved fitting formula to which we applied higher gain values than the NAL-NL1 fitting formula, aimed at English in the high frequency zone (4 kHz, 8 kHz), to compensate for the low energy of Korean language in the high frequency zone.12)
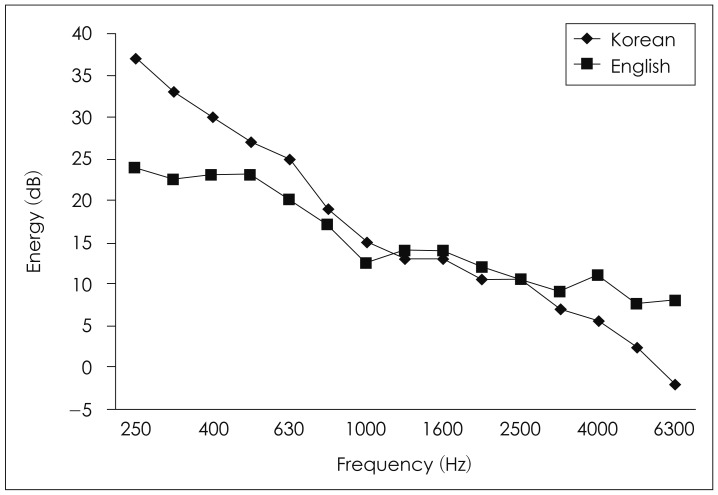
Comparison of LTASS between Korean and English. Korean has less energy in high frequency than English. LTASS: Long-Term Average Speech Spectrum.
Without noise, the awareness of the NAL-NL1 fitting formula was approximately 1.5% higher for the hearing adults and 6.0% higher for the hearing-impaired, respectively, as compared to those of the M-formula adaptation fitting formula. In this case, there was no masking effect of noise with unclear speech and reduced speech volume. On the contrary, in a noise environment, the awareness of M-formula was 31.0% higher for the hearing adults and 19.4% higher for the hearing-impaired, respectively, as compared to those of NAL-NL1, which proved a more efficient fitting formula in a noise environment (p-value<0.05). Subjects were limited to 12 people, 6 with normal-hearing and 6 with impaired-hearing, and the gender was not even. With further research with varied subjects, a more advanced mobile phone for the hearing-impaired as adapted to the characteristic of the Korean language may be helpful.
Conclusion
Due to the distinct feature of high voice energy in the high frequency zone over 4 kHz, the Korean language consumes more voice energy than English in mobile communication. Accordingly, the hearing-impaired with presbycusis has a lower speech discrimination score than the normal-hearing population, due to a voice-loss in the high frequency zone in mobile phones in noisy environments. This research was focused on the speech quality improvement fitting formula for presbycusis patients when using mobile phones in daily lives. The effect was convincing when WRS was improved with the application of the M-formula adaptation. High-frequency gain of mobile phone sound source was increased when applied the NAL-NL1 fitting formula (a hearing-aid fitting formula for mobile phones in noisy environments). In conclusion, we can improve WRS by compensating for the sound source loss incurring from mobile phones for the hearing-impaired with presbycusis, who are not using hearing aids.
Acknowledgments
This research was supported by Basic Science Research Program through the National Research Foundation of Korea (NRF) funded by the Ministry of Education (2010-0020163).