Towards Size of Scene in Auditory Scene Analysis: A Systematic Review
Article information

Abstract
Auditory scene analysis is defined as a listener’s ability to segregate a meaningful message from meaningless background noise in a listening environment. To gain better understanding of auditory perception in terms of message integration and segregation ability among concurrent signals, we aimed to systematically review the size of auditory scenes among individuals. A total of seven electronic databases were searched from 2000 to the present with related key terms. Using our inclusion criteria, 4,507 articles were classified according to four sequential steps–identification, screening, eligibility, included. Following study selection, the quality of four included articles was evaluated using the CAMARADES checklist. In general, studies concluded that the size of auditory scene increased as the number of sound sources increased; however, when the number of sources was five or higher, the listener’s auditory scene analysis reached its maximum capability. Unfortunately, the score of study quality was not determined to be very high, and the number of articles used to calculate mean effect size and statistical significance was insufficient to draw significant conclusions. We suggest that study design and materials that consider realistic listening environments should be used in further studies to deep understand the nature of auditory scene analysis within various groups.
Introduction
It can be difficult to recognize and pay attention to incoming auditory information in everyday situations where background noise is present. Moreover, when listeners' hearing is negatively impacted by factors such as aging and/or hearing loss, they often experience great difficulty in picking out specific information which can also impair their ability to give feedback to a conversation partner. In 1953, Cherry identified the difficulties associated with understanding speech in situations with many speakers by using the term ‘the cocktail-party problem’ [1]. Later, that term was replaced with ‘auditory scene analysis’ by Bregman [2], which refers to a listener’s ability to segregate meaningful signals from meaningless noise among concurrent sounds [3].
To understand the auditory scene analysis, it is important to understand perceptual integration and segregation. Integration and segregation are the perceptual processes that match physical structures in listening environments to mental structures in the listener’s brain. More specifically, integration merges multiple physical structures into a single mental one, whereas segregation occurs when the listener replaces multiple physical structures with different mental structures [4]. Although these two perceptual tools have common temporal and spectral concepts, segregation additionally considers a spatial concept. Some nonspeech sounds are spectrally like speech, and thus are difficult to separate from it. Furthermore, speech itself is composed of acoustic segments of diverse spectral composition, and it would be counterproductive for the listener to try to segregate them as these segments often map to the same linguistic structures [4]. Because of these complications, the concept of segregation should be approached more carefully than integration.
Since 1990, the effect of auditory scene analysis has been examined in various fields such as sound localization [5], interaural time differences (ITDs) [6], neural network modeling [7], computational auditory scene analysis [8], and direction of hearing aids [9]. For example, Dobreva, et al. [5] analyzed accuracy and repeatability in the ability to localize sound across different age groups. Compared to young participants who overestimated horizontal location and underestimated vertical location, older adults showed significantly poorer accuracy and repeatability for all experimental conditions, likely due to the effects of aging on the auditory system. These results suggest that the ability to localize sound is clearly affected by and deteriorated by aging, especially within the central auditory system. Along with sound localization, ITD was considered to be a key factor in analyzing and computing the location of a sound source [6]. Nager, et al. [6] reported that the amplitude of mismatch negativity (MMN) was affected by the location of a sound source that was spatially segregated; that is, as the location of a sound source moved farther away, the deviant minus standard difference (i.e., MMN) in the waveform became larger. Interestingly, such findings suggest that to understand spatial segregation in auditory scene analysis, further detailed investigations into other factors including degree, location, and the limits of spatial segregation are needed.
Roch, et al. [9] applied auditory scene analysis to algorithms for hearing aids. In their results, clear speech spoken by a single speaker had only a 3% or lower error rate in terms of the subject’s auditory scene analysis, while the error rate of conversational telephone speech was as high as 13%. This implies that advanced technology and/or hearing aid algorithms that are designed with auditory scene analysis in mind could effectively enhance and compensate for the speech intelligibility of listeners with hearing loss. Nevertheless, the full characteristics of auditory scene analysis have not yet been fully discussed or documented. While developing the ARTSTREAM model, Grossberg, et al. [7] proposed a neural network model of the auditory scene analysis. Their model focused on the frequency components, and the process of grouping each frequency component in multiple sound environments. With a similar but much extended concept, Wang and Brown [10] recommended computational auditory scene analysis (CASA), which evaluated a listener’s performance in auditory scene analysis by using one or two microphone recordings of the acoustic scene. Since the CASA had the advantage of computationally extracting the descriptions of individual sound sources from the recordings of the acoustic scene, it was extended for use with various subjects, such as multipitch tracking feature-based processing, binaural source localization and grouping, model-based segregation, neural/perceptual modeling, and reverberation.
In summary, auditory scene analysis forms the basis of hearing science and psychoacoustics, and can be extended to improve hearing-assistive devices such as hearing aids and cochlear implants through a variety of engineering applications. Nevertheless, there are not yet any fundamental conclusions about auditory scene analysis from existing studies related to the size and/or numerosity of the auditory scene. Auditory scene size and/or numerosity may be defined as perceptual recognition for the number of sound sources in an environment [11]. Because various sounds are presented simultaneously in real environments [12], it is necessary to measure the ability of listeners to identify and/or localize multiple simultaneously presented sounds [11] to better understand speech perception. The purpose of the present study was to systematically review previous studies related to the size of auditory scenes, using review methods such as a strategy of Participant, Intervention, Control, Outcomes, and Study design (PICOS) and CAMARADES checklist, and consequently determine the average size of a listener’s auditory scene.
Methodology
Systematic search strategy
The Preferred Reporting Items for Systematic Reviews and Meta-analysis (PRISMA) statement [13] and the International Prospective Register of Systematic Reviews (PROSPERO) of Cochrane Collaboration were used, which processed the systematic search for published articles and reported their review.
For the main study results, inclusion criteria of articles confirmed the participants, intervention, control, outcome measures, and study design (better known as the PICOS strategy) [14]. Table 1 displays the PICOS criteria used. Exclusion criteria included animal studies, lack of peer review, articles that were not a research article (e.g., review paper, brief communication, engineering and/or modeling study, and case report), or articles not written in English.
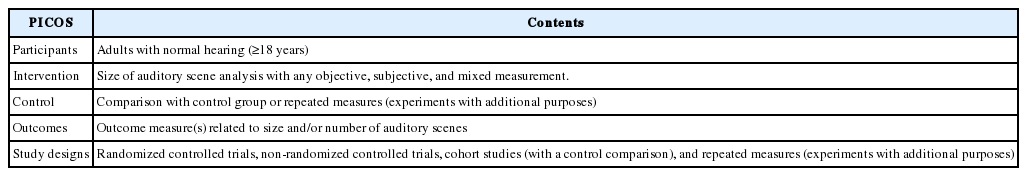
Inclusion criteria based on the Participants, Intervention, Control, Outcomes, and Study designs (PICOS) strategy
Article selection
Seven electronic databases (i.e., Embase, Medline, PubMed, Web of Science, Science Direct, Scopus, PsyclINFO) were searched for literature published from January 2000 to December 2018 using the key terms ‘auditory scene analysis’ OR ‘auditory scene’ OR ‘auditory stream’ AND ‘spatial segregation’ OR ‘sound localization’ OR ‘sound classification’. The terms were always combined to limit identified papers.
The number of articles searched in the electronic databases was 4,507. After eliminating 681 duplicate articles, a total of 3,826 articles was remained. As part of the screening process, their abstracts were confirmed; 3,821 out of 3,826 abstracts failed to meet the inclusion criteria, and therefore only five articles were confirmed to have full text at the eligibility stage. To confirm the full-text articles more specifically, outcome measures of the PICOS criteria were subdivided by the following measurements: 1) objective and/or behavioral measurement, 2) subjective and/or electrophysiological measurement, and 3) mixed measurement (combined objective and subjective). Because one of the five studies failed to meet the PICOS criteria (i.e., participants with hearing loss), four articles were included for review. Each step is explained in Fig. 1.
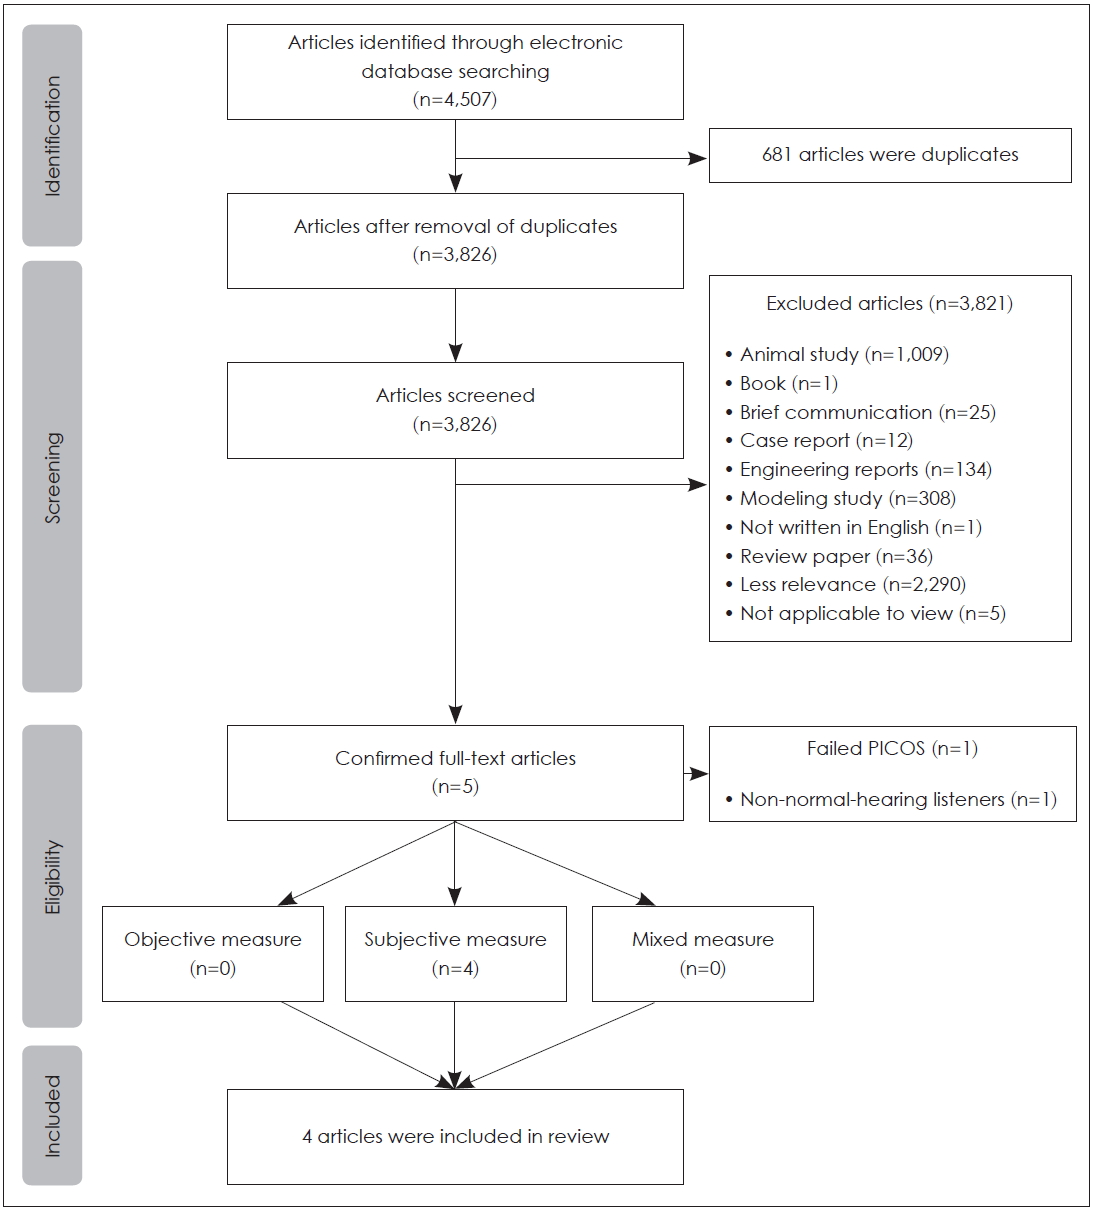
A Preferred Reporting Items for Systematic Reviews and Meta-analysis (PRISMA) flow diagram depicting the inclusion and exclusion process of the current study. A total of 4,507 searched articles were classified according to four sequential steps-identification, screening, eligibility, included. PICOS: Participants, Intervention, Control, Outcomes, and Study design.
Study quality and potential sources of study bias
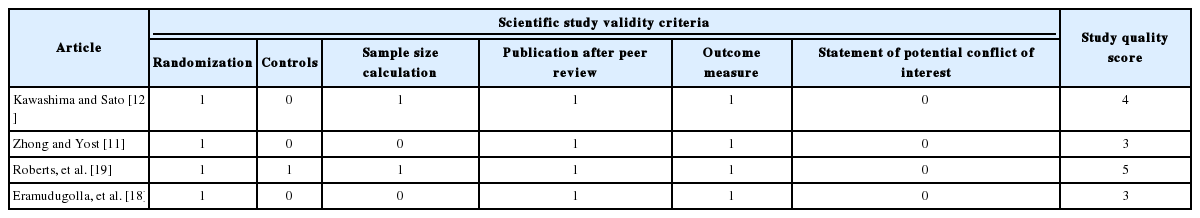
Both study quality and potential sources of study bias were evaluated using the CAMARADES checklist (Table 2) [15]. The CAMARADES checklist contained six independent items: randomization, controls, sample size calculation, published after peer review, outcome measure, and statement of potential conflict of interests. To evaluate study quality, scores were calculated with 1 (YES), or 0 (NO) for each item on the checklist. After providing scores for the study quality, scores of each study were summed up to the levels of evidence based on the 2004 Grading of Recommendations, Assessment, Development, and Evaluation (GRADE) Working Group guidelines [16]. The chi-square test was used to analyze the results of tabulated study quality scores. A low level of evidence indicated relatively ambiguous results of the study, whereas a high level of evidence showed relatively valid study results.
Data regarding participants (number, age, and sex), test materials (apparatus, stimuli, and condition), study design, the main factor of the experiment (number of auditory scene, degree of separation, and levels of background noise), outcome measures, and major findings was extracted and synthesized by two authors independently. A meta-analysis of the reviewed studies could not be conducted due to the small sample size and heterogeneity of the studies (i.e., presence of control group, types of stimuli, and report of outcome measure). Consequently, the results of findings and study quality of the reviewed studies were reported systematically and narratively in the results section.
Results
Four included articles with full-text review were summarized which followed the PICOS strategy and confirmed the size of the auditory scene (Table 3).
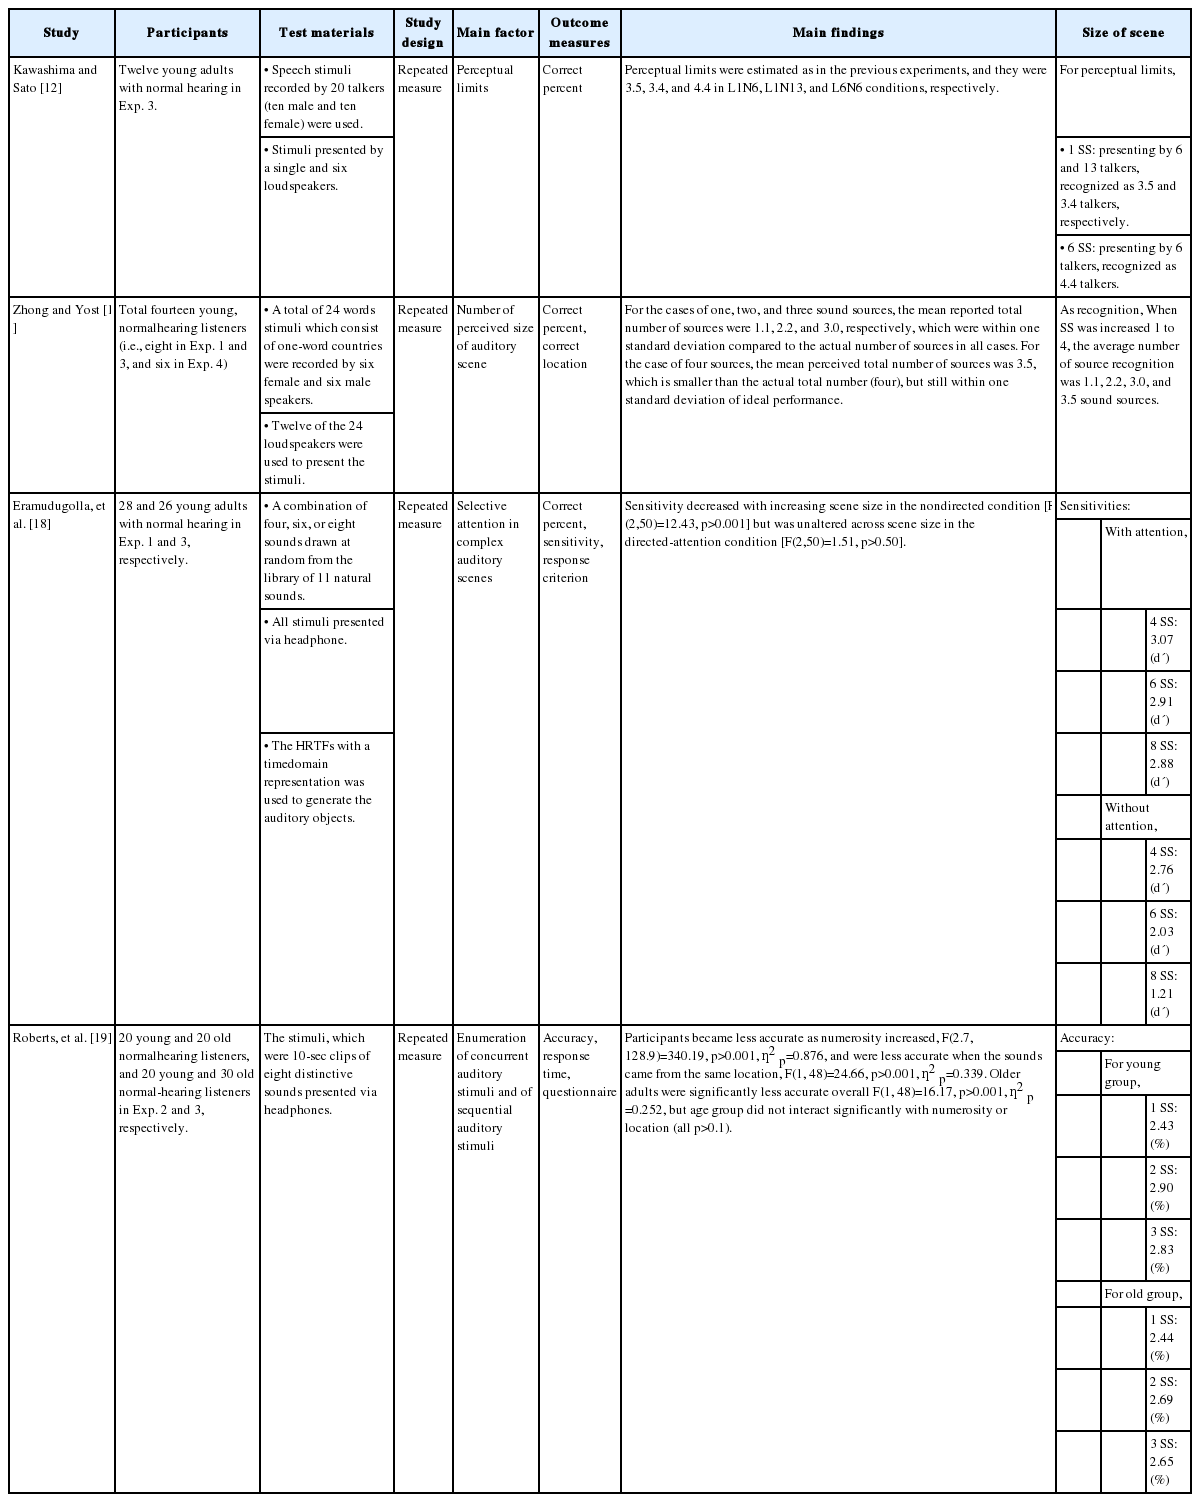
Summary of the extracted and synthesized data from the four included articles
Study quality
The score of study quality based on the CAMARADES checklists is shown in Table 2. The median value of the study quality score was 4 (3 to 5). To identify the goodness of fit of the study quality score, a chi-square test was conducted by using R statistical computing software [17]. There was no significant difference between study quality scores (χ2=0.73, df=3, p>0.05).
Participants
Participants included individuals with normal hearing, both young (18 to 30 years old) [11,12,18] and old (greater than 65 years old) [19]. More specifically, most articles had recruited only young adults [16-18], except for a study by Roberts, et al. [19] which included both young and old adults. The participants in the four articles were not always consistent; while the studies of Zhong and Yost [11] and Kawashima and Sato [12] had relatively small samples (14 young adults and 12 young adults, respectively), the study by Eramudugolla, et al. [18] had a reasonable number of participants. Two of the four articles were balanced in terms of the sex of participants [18,19], but Kawashima and Sato [12] had a relatively female-dominant sample; Zhong and Yost [11] had no available information about the sex of participants.
Intervention
Stimuli, apparatus, and types of measurement (objective, subjective, and mixed measures) were confirmed for the intervention. For the stimuli, two of four articles [11,12] used speech-based stimuli while the remaining two articles used distinctive sounds and natural sounds. For the speech stimuli, Kawashima and Sato [12] used sentences recorded by 20 talkers (10 females), while Zhong and Yost [11] used words spoken by 12 talkers (6 female). As for the apparatus, while Kawashima and Sato [12] presented the stimuli via a single loudspeaker, Zhong and Yost [11] used many loudspeakers (12 to 24 speakers); the other studies reported that they used headphones [18,19]. All articles measured the size of the auditory scene using subjective methods.
Controls
Although study design including randomized controlled trials was desirable to ensure high-level evidence [20], none of the studies included in this review were designed as such. The between-group comparison (such as between young adults versus older adults) was considered as an alternative to assess the effects of any interventions, however, three of four articles showed repeated measures with various additional experiments [11,12,18]. Only one article used between-group comparison [19].
Outcomes
The majority of the included studies categorized their outcomes using response time [19], correct percent [11,12,18,19], accuracy [19] or sensitivity [18] calculated by correct percent, and response criteria [18]. More specifically, while Zhong and Yost [11] used only correct percent as the outcome measure, one study used both correct percent and response time [19]. Interestingly, Eramudugolla, et al. [18] added response criteria based on the detection theory.
Study designs
All reviewed articles reported repeated measures [11,12,18,19]; they included three studies that had three sub-experiments [11,18,19] and one study which had four sub-experiments [12].
Size of auditory scene
All studies reported at least one measure of the size of the auditory scene. In general, the size of the auditory scene matched the number of perceived sounds with the number of presenting sound sources; this held true with up to three sources, and saturated at more than four sound sources.
Kawashima and Sato [12] first conducted an experiment to identify the role the maximum number of talkers plays on numerosity judgements. Their results revealed that the maximum number of perceptual limits was less than the number of presented sound sources. In the condition of a single loudspeaker with six or thirteen talkers, the maximum number of the perceived auditory scene was 3.5 and 3.4, respectively, however the perceptual limit for an auditory scene with many locations (i.e., six loudspeakers with six talkers) was 4.4. Moreover, the sex effect of talkers was analyzed by using single- and mixed-gender voices, and showed that the mean perceptual limits were 3.4 and 4.2 for the single- and mixed-gender conditions, respectively, using a single loudspeaker with six talkers. As the number of loudspeakers increased (e.g., six loudspeakers), the mean perceptual limits increased from 3.4 to 4.1 in the single-gender condition, and increased from 4.2 to 4.9 in the mixed-gender condition. Interestingly, as the number of talkers increased while the number of loudspeakers remained the same, the perceptual limits decreased from 3.4 to 3.2 in the single-gender condition. The mixed-gender condition with a constant number of loudspeakers showed similar results, in that the perceptual limits decreased from 4.2 to 3.8.
In the study conducted by Zhong and Yost [11], the size of the auditory scene was approached in terms of complex listening environments. Eight sound sources were used across 12 to 24 loudspeakers. Using several sound sources randomly presented via the loudspeakers, their results showed that as the number of presented sound sources increased, the number of reported sound sources increased up until a saturation point. The number of reported sound sources was 1.1, 2.2, 3.0, and 3.5 for an increasing number of presented sound sources (one to four, respectively). When the number of presented sound sources increased to eight, the number of reported sound sources was smaller (though greater than four) than the number of presented sound sources, though this number was still within one standard deviation of ideal performance.
Also, the authors also identified the effects of multiple tonal sources by using a total of twelve tones instead of talkers [11]. The frequencies of the tones used were 313 Hz, 419 Hz, 541 Hz, 733 Hz, 863 Hz, 1,019 Hz, 1,277 Hz, 1,511 Hz, 1,993 Hz, 2,633 Hz, 3,457 Hz, and 5,051 Hz. The results showed that the reported number of tones increased as the total number of tones increased; when the number of presented sound sources increased from one to eight, the reported number of sound sources increased from around 1.0 to around 3.0. In terms of spatial segregation, the average reported number of sound sources increased with the actual number of presented sound sources. Obviously, it is easier to recognize the number of sound sources when they are reproduced from each of the speakers than when multiple sound sources are reproduced simultaneously from only one speaker.
Eramudugolla, et al. [18] reported the effects of selective attention on the complex auditory scene. Their study divided the test into two separate conditions; directed-attention, which provided the cued object, and nondirected-attention, which did not. Results showed that the sensitivity of the size of the auditory scene showed worse change detection under nondirected-attention conditions than when under directed-attention conditions. The sensitivity also decreased with increasing sizes of auditory scenes. While those in the nondirected-attention condition were worse at detecting change as the size of auditory scene increased, the directed-attention condition had no such effects when compared to the nondirected-attention condition. Overall, they found that when attention is directed to the identity of the changed object, detection is independent of the number of objects in a scene over the range tested. However, when attention is not directed, detection deteriorates with increasing scene size. More specifically, while the sensitivity did not change much in the directed-attention condition (i.e., approximately 3.3 to 2.8), sensitivity dramatically decreased (approximately 2.7 to 1.3) as the size of the auditory scene increased to 4, 6, and 8 in the nondirected attention group. Examining the results which identify the effects of different locations of sound sources, the sensitivity of the directed-attention group was approximately 3.0 for sounds at both different locations and at the same location. The sensitivity of nondirected-attention group, however, showed dramatic decreases from approximately 3.0 to 1.8 when sounds were in different locations, and decreases from approximately from 2.6 to 1.3 when sounds were in the same location. These results implied that attention (i.e., cued objects) positively affects detecting sound sources in a complex auditory scene. Similar to the results of Zhong and Yost [11], the effects of spatial segregation enhance the ability to detect sound sources in complex auditory scenes.
The results of Roberts, et al. [19], who investigated the effects of the number of locations of sound sources on enumeration performance, showed that older adults had poorer accuracy and response times than young adults. Accuracy decreased with increasing numbers of sound sources (1 to 5), and was worse when the stimuli were presented from a single location compared to when they were presented from two locations. These results suggest that presenting stimuli from two different locations had the same benefit when the number of sound sources was between 2 and 5. In addition, the results of mixed analysis of variance (ANOVA) showed that there was a significant relationship (p<0.05) between age and numerosity which trended with the number of sound sources. Older adults had significantly prolonged response times with increasing numerosity of sound sources (p<0.05). Consequently, the enumeration performance of older adults was poorer than that of young adults, especially for small numbers of auditory objects.
Conclusions and Implications
It is important to identify the ability of listeners to recognize and/or localize multiple sound sources. The concept of numerosity, meaning the ability to perceptually identify a number of sound sources, is considered as the key factor in hearing aid technologies as well as current virtual space or spatial audio processing [11]. This systematic review aimed to determine the size of the auditory scene in the listener’s scene analysis. The reviewed studies concluded that the number of perceived sound sources was approximately three to five in listeners with normal hearing, even when presented with greater than six sound sources, while the size of the auditory scene was not much larger than we expected.
Some studies report a relationship between the size of a person’s auditory scene and their speech perception. According to Yost, et al. [21], the condition of spatial separation which simultaneously presented more than three sound sources was sometimes a useful cue to identify and recognize the stimuli, especially for speech. Moreover, it is well-known that when the number of sound sources increases (i.e., four to six), the ability to identify presented stimuli may slightly improve due to a cue of ITD [19]. While the spatial separation and/or ITD could improve the size of the auditory scene, it is necessary to consider the effects of background noise which negatively affects speech perception ability. Kawashima and Sato [12] reported that the response time for presented speech stimuli was prolonged when the number of background noises increased. In other words, even though spatial separation improves the size of auditory scene, the effects of background noise could negatively affect speech perception ability.
There are many previous studies which struggled to determine the size of the auditory scene [11,12,18,19,21], and they have some limitations. It is still unclear what is segregated and counted when the stimuli are presented as speech. Kawashima and Sato [12] reported that sounds with different acoustic properties (i.e., pitch, timbre, and spatial location) could affect numerosity judgements. Also, the limited attention capacity [22] may play a negative role in affecting the size of the auditory scene. Because the most widely used tool for measuring the size of the auditory scene was accuracy as determined by the correct percentage [11,12,18,19], the listener’s limited attention capacity was not considered, possibly affecting the results.
Regardless, there are some ways to improve and/or maintain speech perception for increasing sizes of auditory scenes [23]. Using the notion of informational masking, where the noise could perceptually interfere with the speech signal [24,25], one approach could be to present speech stimuli while making clear that each speech stimulus occurs not only as a target but also as a distractor [23]. This would make it possible to maintain and/or increase the speech perception ability for the size of the auditory scene.
Furthermore, it is important to imply how many images someone can perceive in realistic listening environments, and to investigate the differences in this ability between young and old adults. As we mentioned in the introduction, as aging deteriorates hearing abilities (i.e., peripheral and central) and cognitive functions [26], the auditory scene analysis naturally decreases over time [27]. Because of this, older adults typically encounter greater difficulty in understanding speech in complex listening environments than their younger counterparts. Bregman [2] argued that older adults were not as efficient as young adults in auditory scene analysis. While investigating the effects of aging on sequential auditory scene analysis, Snyder and Alain [27] also agreed that the older group showed the lowest proportion of head streaming than the other two young groups. Similar results were found using their electrophysiological measure; the activation over the right cortex, especially in the temporal cortex, showed marked age-related decrements in the amplitude of P1 and N2. Such results suggest that the effects of aging negatively affect sound segregation. More recently, Ben-David, et al. [28] focused on the effects of aging on the various types of masker sounds (i.e., speech spectrum noise and babble). Older participants in their study showed decreased correct percentages as the signal-to-noise ratio was decreased (higher noise conditions), compared to young adults. The babble noise masker exponentially decreased the correct percentage compared to the speech spectrum noise masker in both young and old adults. These results demonstrate that age-related differences exist in stream segregation, as older adults showed poor performance regardless of types of masker. Again, due to the mechanism of auditory system in complex sound environments and the effects of aging [29,30], understanding the natural characteristics of auditory scene analysis in older adults is critical. The effects of aging on the size of auditory scene analysis should be identified, and investigations should examine the evidence of related study results. Unfortunately, there have been little to no studies which report the natural characteristics of the elderly to date. Roberts, et al. [19] investigated the differences in the size of auditory scene for young and older adults, but the condition of spatial segregation used only two sources, and various sound clips (i.e., piano solo, clucking, and female news reader) were used instead of speech sound, meaning that conditions did not correspond with real-world situations. To understand communication ability in the elderly, the effects of speech stimuli for the size of the auditory scene in segregated listening conditions which are similar to natural listening conditions should be considered. For further study, the consideration of study designs (case control study) and materials (stimuli and apparatus) which are similar to realistic listening environments will provide a better understanding of the natural characteristics of the size of the auditory scene.
Acknowledgements
This work was supported by the National Research Foundation of Korea (NRF) grant funded by the Korea government (MSIT) (2019 R1F1A1053060).
Notes
Conflicts of interest
The authors have no financial conflicts of interest.
Authors’ contribution
Conceptualization: All authors. Formal analysis: Chanbeom Kwak. Funding acquisition: Woojae Han. Methodology: All authors. Supervision: Woojae Han. Validation: Woojae Han. Visualization: Chanbeom Kwak. Writing—original draft: Chanbeom Kwak. Writing— review & editing: Woojae Han.