


Introduction
In everyday listening, people with normal hearing capacities require little or no effort to process speech. However, when the listening environments are distracted [for example, those with poor signal-to-noise ratios (SNR) or with reverberations], additional efforts are required to hear the target sounds or words selectively. These additional efforts are referred as ŌĆślistening efforts,ŌĆÖ which is the mental exertion of the listeners required to hear and understand incoming auditory information [1].
Several studies have investigated the effects of noise and reverberations on the listening efforts in young and older adults. It has been found that speech recognition performances of the two groups were negatively affected by both background noise and reverberations; however, the patterns of listening effort were dissimilar. The listening effort in young adults seemed to be affected to a greater extent by background noise than that by reverberations [2,3], whereas the effort in older adults was more sensitive to reverberations [3]. This discrepancy can be explained by the greater limitation in cognitive capacity of older adults. Sarampalis, et al. [4] measured listening effort objectively using a word-holding task during activities analyzing short-term memory or while performing visual tasks, and showed that noise reduction reduced mental effort. Additionally, Hornsby [5] reported that impaired hearing requires more cognitive resources and thus, leads to mental fatigue caused by excessive listening effort. Despite the numerous studies that analyzed the effects of background noise and reverberation on listening effort, knowledge regarding the relationship between degraded speech and listening effort and the effects of this relationship on brain activity is limited. Further, though behavioral self-reported tests have been used to measure listening effort due to easy accessibility and convenience, they fail to analyze the specific cortical activity in listening effort when speech signals are presented in various distracting listening environments.
Recently, various modalities for the objective measurement of listening effort have been introduced. One of these non-invasive and objective modalities include the event-related potentials (ERPs), which assess the brain responses in listeners during hearing or concentrating on incoming signals [6]. In 2012, Bernarding, et al. [7] conducted an auditory syllable-detection task while presenting the target syllable in both difficult and easy conditions and consisting of similar and non-similar syllables, respectively. The phase synchronization of the N1 component increased systematically as the task difficulty increased, and considerable listening effort was required to perform the more challenging auditory task. However, the authors focused only on the detection processing of syllables that require relatively lower level of speech processing in the brain. Later components such as novelty P300, N400, or late positive potential have been suggested to reflect listening effort indirectly [8]. Of these, the N400 component is known to increase negatively in response to semantic violations [9] and is a potential objective measure of listening effort. In semantic mismatch, the ERP produces increased negativity approximately 400 ms post onset of the stimuli of interest and is called the ŌĆśN400 effectŌĆÖ [10]. Although the most common paradigm is a congruency test using sentence material, N400 is also elicited by semantic priming tasks [11] or by matching semantic material to a visual display [12]. Interestingly, the amplitude of N400 response is likely to vary due to several factors such as response time, but its latency is relatively stable, particularly for visual words in manipulated conditions [13].
More recently, Finke, et al. [14] measured listening effort using both an ERP task and a subjective listening scale. The traditional oddball paradigm was used in various conditions such as quiet, stationary, and modulated noises for cochlear implant (CI) recipients and adults with normal hearing. As expected, the CI recipients showed prolonged N2/N4 and P300 responses and reported higher ratings on the listening scale compared to their normal hearing counterparts. A correlation among shorter ERP latencies and enhanced speech intelligibility in N1 (or N100) and N2/N4, a better lexical fluency in N1, and lower ratings of listening effort in N2/N4 was observed in CI users. Finke, et al. [14] analyzed the effects of auditory condition on listening effort in CI users who lack the access to fine-structure cues. However, they did not include reverberation, which also hinders speech intelligibility leading to listening effort even in the healthy population.
Despite the shared consensus regarding the effects of background noise and/or reverberation on listening effort, no combined behavioral and electroencephalography study has been performed in young healthy adults. A few studies have investigated the effect of acoustic environment in CI users. In this study, we investigated the effects of adverse listening, such as listening in the midst of background noise or reverberation, on the healthy brain. Based on the results, we expect the clinician to measure the listening effort objectively and to expand the knowledge regarding mechanisms underlying the human strategy of processing and/or understanding speech in adverse listening environments.
Subjects and Methods
Participants
Eighteen young adults with normal hearing abilities (12 female, mean age 25.56┬▒2.36 years) participated in the study voluntarily. Hearing of the participants was screened using pure-tone audiometry. The inclusion criteria were right-handedness, native Korean speakers, and absence of any neurological or neuropsychological history. The participants were also screened using the Korean version of mini-mental state examination to exclude participants with the possibility of dementia and/or severe working memory problems [15,16].
All participants provided written informed consents before conducting the experiment. The experimental procedure was approved by the Institutional Review Board of Seoul National University Hospital (IRB Approval No.: H-1703-097-840) and complied with the Declaration of Helsinki, International Conference on Harmonization, Guidelines for Good Clinical Practice.
Stimuli
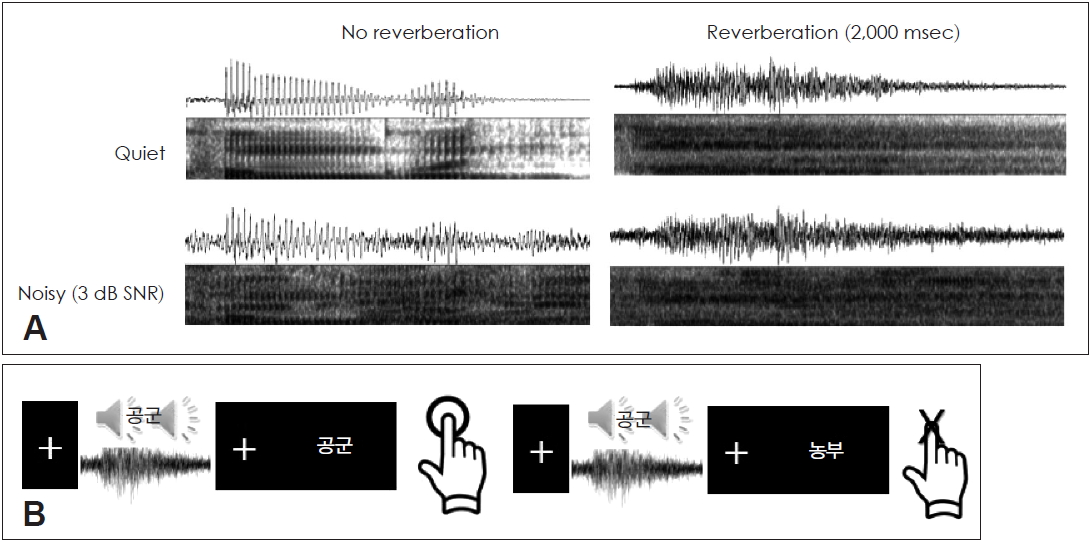
For the auditory stimuli, various sentences for Korean speech perception in noise [17] were used. In total, 117 sentences, spoken by a professional female speaker, were adjusted by equal root mean squares of -20 dB using Adobe Audition (v. 5.0, Adobe Systems, Inc., San Jose, CA, USA), as suggested by Kwak, et al. [3]. A total of 234 bi-syllable Korean nouns were selected from the sentences within the range of elementary to middle school level familiarity. We manipulated the background noise and reverberations while congruent or incongruent prime target-pairs were presented to elicit the N400 response.
Based on the findings from a previous study [3], 2000 ms reverberation and 3 dB SNR background conditions were chosen to obtain the four combinations of quiet background with no reverberation (Q-0 ms), quiet background with 2000 ms reverberation (Q-2000 ms), 3 dB SNR with no reverberation (3 dB-0 ms), and 3 dB SNR with 2000 ms reverberation (3 dB-2000 ms). The visual stimuli were also written Korean bi-syllable nouns. Fig. 1 shows an example of the stimulus conditions and presentations of audio-visual stimuli.
Experimental procedures
Electroencephalograms (EEG) were recorded with a 64-electrode system using a SynAMPS II amplifier with Curry software (ver. 7, Compumedics Neuroscan, Victoria, Australia) and an electrode cap with sintered Ag/AgCl electrodes (Quick-Cap, Compumedic Neuroscan, Victoria, Australia) in a lighted room shielded against sound and stray electrical fields. Signals were referenced to linked ears, digitized at the rate of 1,000 Hz and bandpass-filtered using frequencies of 0.1-200 Hz, while electrode impedances were kept below 5 k╬® throughout the sessions for all participants. Vertical and horizontal electro-oculography were performed along with electrocardiography. During the recording, the listeners were seated upright with their eyes fixed on a cross mark.
Auditory stimuli were presented binaurally using ER2 insert earphones (Etymotic Research, Inc., Elk Grove Village, IL, USA), while visual stimuli were presented on a black background of a 17-inch monitor more than 60 cm away from the participants with a visual angle of 6.0-7.0 degrees using the Presentation software (ver. 18.1; Neurobehavioral Systems, Inc., Berkeley, CA, USA; www.neurobs.com). Each session commenced with a fixation mark 100 ms long. A pair of sounds and letters in a 2├Ś2 (presence/absence of reverberation and background noise) paradigm [3] was presented either congruently or incongruently to elicit a semantic mismatch. A prime sound was played for approximately 500 ms followed by the letter lasting 2-3 s. The sessions were jittered to prevent any estimations at the onset. The participants were then asked to press a button to confirm whether the prime sound and the target letter did or did not match [10]. Responses were collected for a behavioral error rate analysis to be performed later. A break of at least 3 minutes was ensured between two experimental sessions.
Data processing and analysis
The obtained data were excluded if more than six (10% of the total channels) or less than 30% (20-22 trials out of 65-72 trials) bad channels were recorded following the suggestion of Picou, et al. [2]. Further, the data were filtered offline using 0.1-30 Hz Butterworth band-pass filters. Epochs of 1,000 ms were extracted with a 200 ms pre-stimulus baseline and were excluded if they included amplitudes exceeding ┬▒100 ╬╝V. Further artifacts associated with eye blinks and muscle movements were corrected using an independent component analysis [18] and additional visual inspection before re-referencing to a common average reference. Bad channels were defined as less than 10 channels requiring correction using automated spherical spline interpolation [19]. Trials containing more than 10 bad channels were rejected. After baseline correction, the grand means for each condition were computed.
The centro-parietal (CPz), parietal (Pz), and parieto-occipital (POz) electrodes were chosen to obtain N400 latencies based on the difference in the wave between congruent and incongruent signals [3]. Spectral power (event-related spectral perturbation, ERSP) was also computed during the time of interest (N400) at alpha (8-12 Hz), beta (14-24 Hz), and gamma (25-29.5 Hz) frequency bands. ERSP measures the average time course of relative changes in the EEG amplitude spectrum induced by a set of similar events [20]. Sources were localized in the time range of 251-450 ms post stimulus onset, which covers N400 latencies, using exact low-resolution brain electromagnetic tomography and applying a realistic head model using human EEG [21]. In this study, we only focused on the activity changes in the beta frequency band.
Statistical analysis
Using SPSS software (ver. 22.0; IBM Corp., Armonk, NY, USA), two-way analysis of variance with repeated measures was performed to test the effects of noise and reverberation. The level of statistical significance both for the behavioral and ERP data was set at p<0.05. To identify any potential differences across listening conditions, non-parametric statistical analyses for each contrast using multiple voxel-by-voxel comparisons to obtain a logarithm of the F-ratio were performed. The significance of the log F-ratio is a threshold (p<0.05) based on a random test with 5,000 permutations [22]. Other statistical analyses were performed using the SPSS software and built-in functions provided by Matlab (R2014a, Mathworks, Natick, MA, USA). All data were presented as a mean┬▒standard deviation (SD), and an outlier was defined as greater than mean┬▒2SD.
Results
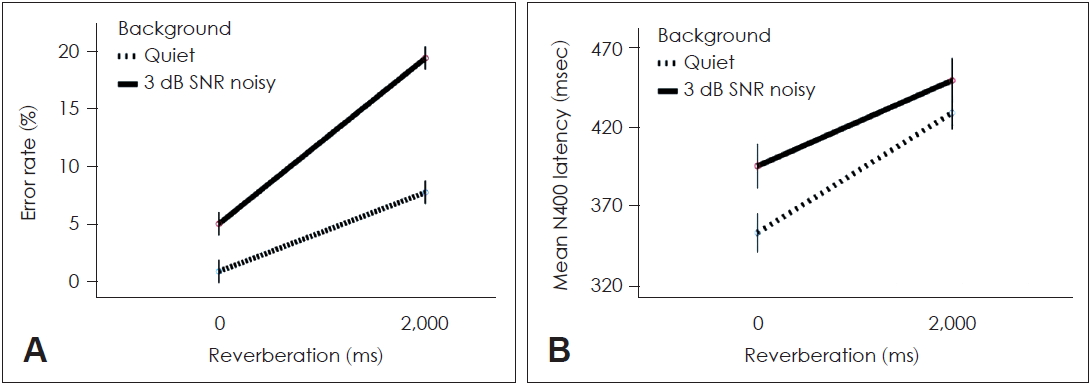
In the behavioral error-rate analysis, Q-0 ms showed the least errors (0.78┬▒0.81%), followed by 3 dB-0 ms (4.89┬▒0.90%). However, when reverberation was modulated by 2,000 ms, the error rate significantly increased in both Q-2000 ms (7.61┬▒1.61%) and 3 dB-2000 ms (19.22┬▒3.81%) as shown in Fig. 2A.
In the N400 responses, Q-0 ms revealed the shortest latency (357.06┬▒55.33 ms). Q-2000 ms showed increased latency to 426.17┬▒62.70 ms even without background noise. Further, 3 dB-0 ms resulted in a latency of 379.22┬▒47.54 ms, while 3 dB-2000 ms showed increased N400 latency to 459.67┬▒66.15 ms (Fig. 2B). However, no significant differences in N400 amplitude were observed among the four listening conditions.
The behavioral and neurophysiological data showed similar patterns. Highly significant simple principal effects of background noise [F (2,36)=4.73, p=0.008] and reverberation [F (2,36)=6.31, p=0.006] were observed. Significant interactions were also observed between background noise and reverberation (p<0.01). Specifically, reverberation increased the error rate and N400 latency significantly. The behavioral effects of reverberation were more significantly associated with listening difficulty, whereas the neurophysiological effects of both background noise and reverberation significantly affected listening effort.
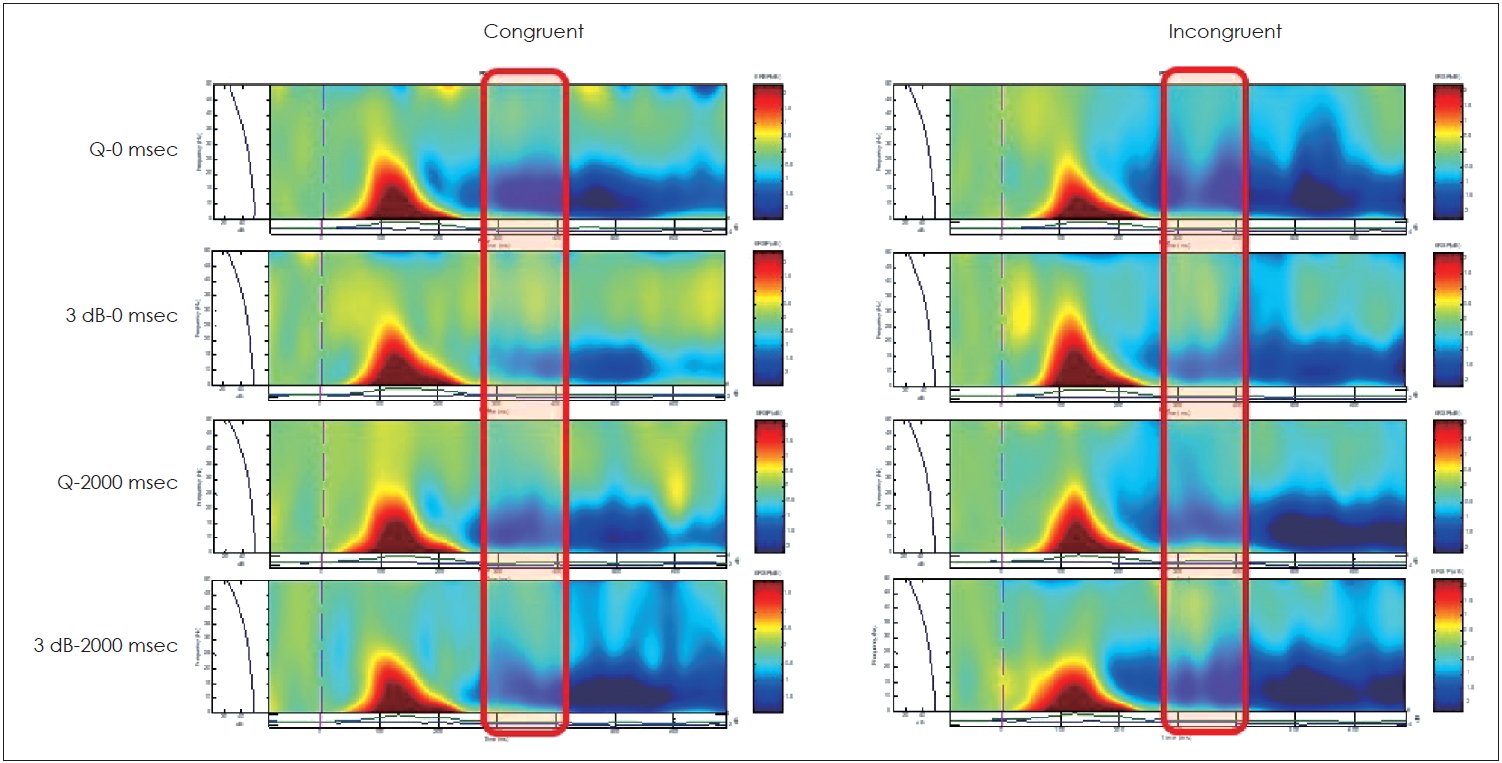
Fig. 3 shows the grand mean averages plotted at Pz electrodes for the four different listening conditions, with slightly altered appearances, because the analysis was performed with the mean latencies of the CPz, Pz, and POz electrodes to obtain N400 latencies, based on the differences in waves between the congruent and incongruent signals [9]. The shaded pink area represents the time window of the N400 peak latency. Compared to Q-0 ms, background noise 42.18 ms (ns.), reverberation 75.50 ms (p=0.043), and background noise + reverberation 96.28 ms (p=0.0003) showed delayed latency. The resulting ERSP showed greater incongruent stimuli across all listening conditions. The red box in Fig. 4 represents the time of interest covering the N400 peak latencies.
In terms of spectral power for the alpha frequency band, quiet conditions showed higher power (4.07 dB) than noisy conditions (1.66 dB). Beta power showed lower power in quiet conditions (2.37 dB) than that in noisy conditions (5.12 dB). Gamma power showed a similar pattern to alpha of higher power in quiet (5.76 dB) than that in noisy conditions (2.38 dB), as shown in Fig. 5A. Specifically, in the ERSP for the beta frequency band, similar patterns were observed with behavioral error rate and N400 latency across listening conditions (Fig. 5B). Beta activity correlated with the behavioral (r2=0.31, p=0.016) and electro-physiological results (r2=0.26, p=0.032); however, the alpha and gamma powers did not correlate significantly with either error rate or N400 latency. This finding is in line with the literature supporting that the beta power is associated with attention and task difficulty, and increase in beta power reflects high performance [23].
Frontal activity enhancement was shared for all the contrasts. Regardless of noise, reverberation showed a significantly increased electrical activity in the right middle frontal area [Brodmann areas (BA), 46 and 10; p<0.05] for the beta frequency band compared to no reverberation. Noise increased the activity in the left superior frontal region (BA 9; p<0.05), regardless of reverberation. The effects of noise were further observed in the left superior frontal gyri from the contrast of 3 dB-0 ms>Q-0 ms (BA 10; p<0.05) and the contrast of 3 dB-2000 ms>Q-2000 ms (BA 9; p<0.05) as shown in Fig. 6A. The effects of reverberation were further observed in the right superior frontal area from the contrast of 3 dB-2000 ms>3 dB-0 ms (BA 11; p<0.05) and in the left superior frontal area from the contrast of Q-2000 ms>Q-0 ms (BA 10; p<0.05) as shown in Fig. 6B. Table 1 summarizes the results of the highest level of activation localized across the contrasts in listening conditions.
Discussion
The present study investigated how adverse listening, such as listening amidst background noise or reverberation, modulated the healthy brain. As a candidate for an objective measurement of listening effort, we analyzed the N400 component and tested the relationships between behavioral (i.e., error rate) and electrophysiological data (i.e., latency, spectral power, and electric source activity associated with the N400 component). We found a significant correlation among the factors associated with increased error rate and increased listening effort.
Our results showed that background noise and reverberation are the factors that interrupt the processing of semantic mismatch in the brain, as evidenced in the increased error rate and delayed N400 latency. Behaviorally, background noise and reverberation increased the error rate, indicating an increased listening effort. Particularly in the reverberation of 2,000 ms, this increase was pronounced. Further, electrophysiological data confirmed delayed N400 peak latency as a function of listening effort. A positive correlation was observed between the beta band spectral power and frontal electric activity, i.e., higher the beta power, higher the error rate and source activity at the beta band. The error rate, N400 latency, beta band frequency power, and source activities showed significant correlation, implying that the N400 component can be proposed as an objective measure of listening effort. Further, increased listening effort was associated with strong involvement of the frontal sources, a finding in line with literature supporting the view that the frontal lobes are generally involved in complex tasks [24]. Hence, N400 latency can be suggested as a powerful candidate for the objective measurement of listening effort with the background noise of 3 dB SNR and 2000 ms reverberation.
As a caveat, despite the instructions at the preparation stage and those by the PC monitor during EEG recording, we were unable to completely control button pressing, which was performed slightly earlier than instructed. We speculate that some cancellation might have occurred, since all conditions contained the same motion artifacts due to button pressing. The current auditory-visual semantic mismatch paradigm was used in this study, because the used auditory material included background noise and reverberation and thus, did not evoke sufficient time-locked potentials. Instead, we additionally observed the differences in spectral power for the three frequency bands. Our result showed that the ERSP on the beta frequency band alone was enhanced with the increase in processing difficulty, thereby reflecting the increased listening effort. This finding agrees with that of a previous paper by Giannitrapani [25] in that the beta band EEG has long been assumed to reflect cortical engagement, such as that occurring during mental arithmetic, and the attention cognitive resources in our study might have been associated with ERSP enhancement on the beta frequency band.
It is known that attention is a prerequisite for N400. However, a controversy that N400 is not observed in an unattended ear condition [11] whereas is present when no task was required [26], exists. Since our study involves strong attention, which requires identification between the proceeding prime auditory stimuli and the following visual target letters, further study is required to dissociate this controversy.
Although the sample size in this study was small, significant results that N400 latency and beta power within the N400 time window could contribute as objective measures for determining listening effort were obtained.
Unlike in previous studies [2,3], we observed that young adults with normal hearing abilities were affected by reverberation to a greater extent. We speculate that this could be due to the parameters of the acoustic conditions. The results of Kwak, et al. [3] were postulated using the means of four different noise/reverberation conditions (Quiet, +6 dB SNR, +3 dB SNR, 0 dB SNR/no, 500, 1,000, 1,500, 2,000 ms). In contrast, we used Quiet, 3 SNR, 0, and 2,000 ms listening conditions in our study.
The effect of reverberation is different from the effect of simple additive noise, although both lead to limited access to fine-structure cues and hinder speech intelligibility [27]. Reverberation is related to acoustic distortions of overlap-masking or self-masking [28], smearing the amplitude envelope, prolonging phoneme duration, and obscuring the onset or offset of the voicing and blurring formant transitions [29], which are associated with informative masking effect to a greater extent. In contrast, background noise is concerned with energetic masking. A neuroimaging study reported that listening in energetic masking environments activated the temporal regions, while that in informative masking conditions recruited regions other than the typical language processing areas, indicating that reverberation and noise act as masks in distinctly different ways [30]. Since N400 reflects higher cognitive processing beyond language, we speculate that reverberation (informative masking) increased latency leading to higher listening effort compared to noise.
In our study, we targeted young healthy adults with normal hearing capacities and found that reverberation contributed in the prolongation of N400 latency to a greater extent. Future studies will be required to expand the efficacy of the N400 component in estimating listening effort in hearing loss and other adverse listening conditions. In the future studies, we plan to investigate how background noise and reverberation modulate the brain of the population with hearing loss.