


Introduction
The speech chain represents the overall process of perception and production of speech [1]. The speech chain involves three stages: linguistic, production, and acoustic. The linguistic stage begins with a speaker encoding a message. At the production stage, speech is produced through articulation and lastly, at the acoustic stage, sound is heard by the listener through his or her auditory system. The smallest unit of sound that distinguishes meaning is the phoneme and it is a segmental element of speech. Suprasegmental or prosodic elements, on the other hand, include pitch, loudness, and length. These elements are the non-linguistic aspect of communication that conveys the emotions and intentions of the speaker, going beyond mere words. For example, when individuals express emotions, such as fear or anger, variations in stress and intonation patterns can be observed [2-4]. These suprasegmental elements can also contribute to differences in meanings and when this occurs, it is called prosodeme [5].
Cochlear implant (CI) is one of the hearing devices that can be used for individuals with severe to profound sensorineural hearing loss. A CI consists of two components: internal and external. The internal component refers to the electrode array which sends signal to the auditory system. The external component plays a key role in transferring sound from outside to the electrode array through a coil. CIs are typically recommended for those whose hearing loss cannot be managed with hearing aids [6-9]. Significant advancement in technology, surgical technique, and aesthetics has been made and the benefit of CI in speech understanding has been well noted in literature [10-18]. While CI can increase individuals’ ability to understand speech, it is important to also note that not everyone experiences this benefit; even if hearing can be restored through CIs, some individuals still struggle with communication, especially in the aspect of prosody [19-23]. Marx, et al. [19] conducted a study to investigate the discrimination performance in 21 CI users using with a statement-question intonation task and a F0 difference limen test. Here, the participants were divided into two groups (with and without residual hearing). Overall, CI users with residual hearing perceived prosody and F0 better than those without residual hearing. In Klieve and Jeanes [24], children with CIs performed below 80% on the Perception of Prosody Assessment Tool sub-tests that examined various aspects of prosody, such as stress and tone and affect, and in Lenden and Flipsen [25], the authors analyzed 40 speech samples from children with CIs and reported noticeable problems with stress and resonance quality (i.e., loudness, rate, and laryngeal quality).
A possible factor contributing to this issue is characteristics of current measurement tools in clinic. Various tests, such as speech-in-noise test, are used to assess individuals’ speech performance before and after CI surgery. However, these types of tests only focus on the segmental aspect of speech. For example, the Korean version of the Hearing in Noise Test is commonly utilized to assess individuals’ ability to understand speech in quiet and noise using a listen-and-repeat task, but this test does not contain any sentences with different intonations or prosody changes. Since suprasegmental elements could also play a role in delivering messages, it is important to examine people’s ability to recognize the prosodic elements in speech. This study explores how prosodic elements are perceived by those with normal hearing (NH) and CIs.
Subjects and Methods
Participants
The inclusion criteria of the study were as follows: 1) native Korean speakers, 2) prelingual hearing loss, 3) speech intelligibility rating score of 5, and 4) Categories of Auditory Performance (CAP) scores of at least 6. The speech intelligibility rating assesses the intelligibility of speech produced by CI users [26]. It has five categories with category 1 being no intelligible speech and category 5 being intelligible speech with little or no concentration for the listener. The CAP also is a scale rating CI outcomes with seven categories with 0 being no display of sound awareness and 7 being able to perform a telephone conversation [27]. The exclusion criteria included individuals with neurological and mental disorders. All experimental procedures met the standards of the Helsinki Declaration of 2013 and were approved by Samsung Medical Center’s Institutional Review Board (IRB no. 2016-07-19). An informed consent document was obtained from the participants as well as their caregivers.
Speech perception testing
The Seoul National University Hospital (SNUH)-Speech Perception test which consists of 70 sentences (10 sentences per list × 7 lists) was used for testing [28]. The participants were asked to listen to the target stimuli, which was presented at 65 dB SPL, and repeat them back to the tester. The total score was calculated based on the correct responses (1 point for correct response and 0 point for incorrect response).
Speech prosody perception testing
The speech prosody perception test involved two types of testing. For all testing, recordings of stimuli were presented through a loudspeaker located 1 m away from the participants at 65 dB SPL. The first testing used three phonemes: /a/, /^/, and /i/. These phonemes have different meanings based on the prosody changes. For instance, depending on prosody change, /a/ can mean hurt (as in “ouch”) or opening of the mouth for eating. The participants were provided with pictures describing each phoneme stimulus and chose the right one for the stimulus they heard. The second part of the testing used words: positive word (PW) and neutral word (NW). As shown in Table 1, positive words have positive meaning and neutral words have neutral meaning. For all words, prosody changes (positive and negative) were made. For example, for the word “good job” that corresponds to PW, a negative prosody change was made so the meaning of the word changed from positive to negative. In the semantic-syntactic level, two combinations of words were made. For word combination (WC) 1, the adverb “really” was added to the verb or adjective belonging to each word group. For WC 2, the word itself was repeated twice. The participants listen to a total of 48 stimuli, consisting of PW and NW each. If they correctly identify whether the sound has positive or negative meanings, it is considered as a correct response. The percentage score is calculated by dividing the number of correct responses by the total number of stimuli.
Pitch difference discrimination and melodic contour perception testing
The complex-tone pitch discrimination test from the Korean version of the Clinical Assessment of Music Perception (K-CAMP) was used for pitch difference discrimination testing [29]. The K-CAMP was administered using a MATLAB program (MathWorks, Natick, MA, USA) and sounds were presented through a loudspeaker located 1 m away from the participants. The complex-tone pitch discrimination is a two-alternative forced-choice test where the participants listened to two different tones and chose a tone that had higher pitch. Upon completion, the just-noticeable-difference limen (DL) in semitones were determined for 262, 330, and 392 Hz which are base frequencies.
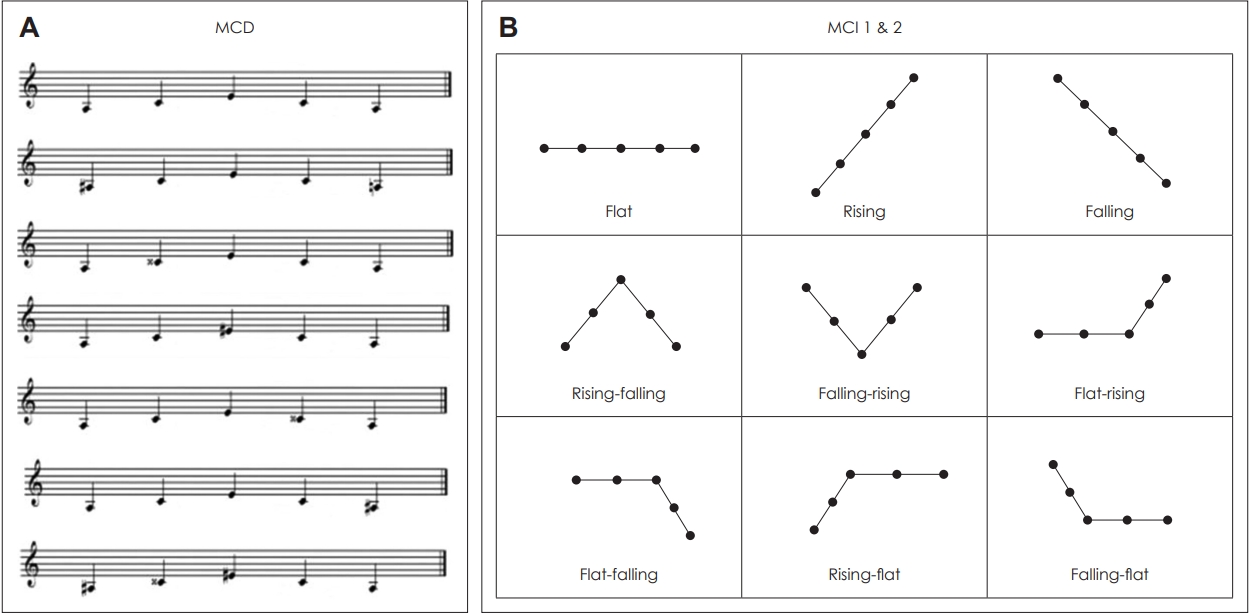
The melodic contour perception testing was composed of melody contour discrimination (MCD) testing and melody contour identification (MCI) testing (Fig. 1). These tests were conducted based on Galvin, et al. [30] which introduced this test for CI user and NH listeners. For the MCD test, an ascending-descending melodic contour (A4-C#5-E5-C#5-A4) using the notes 1 (A4), 3 (C#5), and 5 (E5) within the range of A4 (440 Hz) to E5 (659 Hz) was created as a reference. Some of the constituent notes of the reference melodic contour were randomly adjusted by a semitone to create a pair of melodic contours: the reference contour and the adjusted contour (e.g., A4-C#5-E5-C#5-A4 vs. A4-C#5-E5-C#5-A4#). The first task was to discriminate between the reference contour and the adjusted contour pairs (MCD 1). If the participants perceived the two different, the second task was to identify the different one (MCD 2). MCI was also constructed based on A4 (440 Hz) as a reference. In MCI 1, participants listened to melody contour sounds and responded to which pair of contrasting contours (i.e., “rising” and “falling”) they corresponded to. In MCI 2, a picture panel of the nine melody contours was randomly presented, and participants were asked to identify the melody contour.
Speech prosody production testing
For the speech prosody production testing, the task involved varying the emphasized syllable in a meaningless four-syllable sequence. The aim was to determine whether the participant produced appropriate prosodic variations or differences between the target syllable and the other syllables. In order to evaluate the participants’ ability to produce these syllables, the participants wore a headset microphone that was connected to a recording device. The microphone was positioned at a distance of 3–5 cm directly from the participants’ mouths. The audio signals were digitally recorded and saved as 16-bit WAV files with a sampling rate of 44.1 kHz. The consonant /m/ was used for this test. It is a nasal sound in Korean that does not involve articulatory involvement of the tongue, thus minimizing articulatory burden. Vowels were composed to reflect the presence or absence of distinctive features. The vowels /a/, /i/, and /u/, corresponding to the extreme points of the vowel chart in Korean, are used as reference points. Hence, the four-syllable meaningless sequences were composed by combining the consonant /m/ with a vowel: mamamama, mumumumu, and mimimimi.
Results
Participant characteristics
A total of 26 participants (13 CI users and 13 age- and gender-matched controls) were recruited for the study (Table 2). The average ages of the participants were 19.8 years (SD=3.0) for the NH group and 19.0 years (SD=2.8) for the CI group. The CI users had prelingual hearing loss prior to implantation. The average age of implantation and CI use were 8.7 years (SD=3.04) and 10.3 years (SD=2.17), respectively. The average SIR and CAP scores were 5.0 (SD=0.1) and 7.0 (SD=0.3), respectively.
Speech prosody perception performance between the NH and CI groups
Table 3 illustrates the two groups’ performance in various prosody conditions. For both phoneme and words, the CI group showed significantly lower performance than the NH group in all conditions except in the NW negative prosody conditions for word and word combination 2.
Pitch difference discrimination and melodic contour perception performance between the NH and CI groups
As described in Table 4, there was a statistically significant difference between the NH and CI groups on the complex-tone pitch discrimination test (p<0.05). Statistical significance was also observed for all tests (MCD 1 and 2 and MCI 1 and 2) on the melodic contour perception test (p<0.05 for MCI 1 and p<0.001 for the rest).
Speech perception performance between the NH and CI groups
All participants in the NH group showed 100% on test. The average score for the CI group was 89.8%—all participants scored higher than 75%. Statistical significance was observed for all test conditions (p<0.001) for the two groups.
Speech prosody production performance between the NH and CI groups
An analysis was conducted to examine whether there were differences in mean pitch, intensity, and duration (length) for each target syllable emphasized in the utterances “mamamama,” “mimimimi,” and “mumumumu” between the NH and CI groups. As indicated in Table 5, there were no distinct differences between the groups. There were also no significant differences observed between the target syllables with emphasis in “mamamama,” “mimimimi,” and “mumumumu.”
Discussion
In this study, individuals’ ability to perceive prosodic elements was investigated. For the most part, as one could expect, NH listeners’ performance was significantly better than CI users. This not only includes the speech perception test, but also the speech prosody perception, pitch difference discrimination, and melodic contour perception tests. Although the CI users showed an average performance of 89.8% on the speech perception test, the average score for the NH group was significantly higher, which was 100%. At both phoneme and word levels, except for NW with negative prosody changes and WC 2 where the word was repeated twice, the NH group showed significantly better performance. The NH listeners were able to differentiate pitch and melodic contour significantly better than CI users. These findings are in line with previous studies that CI users are able to understand the segmental aspect of speech better after implantation, but still have difficulty with the prosodic elements embedded in speech [23,31-36]. Luo, et al. [35] explored emotion recognition ability in NH listeners and CI users using five emotions: angry, anxious, happy, sad, and neutral. The participants listened to recordings of speech and were asked to choose the emotion contained in the recording. While those with NH showed an average performance of 89.8%, the CI users showed significantly poor performance (44.9%), demonstrating that CI users have greater difficulty utilizing the suprasegmental aspect of speech. Nakata, et al. [23] recruited children with NH and CIs and compared their ability to perceive speech prosody. Sound stimuli containing neutral utterances with various prosody changes (happy, sad, and angry) were presented through a speaker and the children chose the emotion contained in the stimuli. The results showed that those with NH scored 100% while those using CIs performed poorly on the task (mean accuracy levels of 61% for happy, 64% for sad, and 39% for angry). For CI users with prelingual hearing loss, both segmental and suprasegmental information perception began through the use of CIs and other hearing devices as well as the aural rehabilitation process that focuses on the segmental aspect of speech. Therefore, during the early language development period in infancy, the CI group may have had relatively insufficient exposure to suprasegmental stimuli, such as the discrimination of suprasegmental information [37,38]. As a result, in the process of spoken communication, suprasegmental features might become confusing information that hinders the understanding of the intended meaning conveyed by the speaker, rather than serving as cues for speech perception. Even for those with postlingual hearing loss, they are able to maintain 85% of speech comprehension and a CAP score of 6 after receiving a CI, enabling them to do daily conversations without the need to visually observe lip movements. However, when subjected to the speech prosody testing proposed in this study, these individuals demonstrated poor performance in the range of 70% [39]. Consequently, while segmental information perception improved to a level comparable to individuals with NH through CIs, perception of subtle rhythmic variations remained limited. Furthermore, the participants’ performance in speech prosody testing was found to have a statistically significant inverse correlation with the duration of the time during which they did not receive any benefit from hearing aid use. Hence, even in individuals had sufficient opportunities to perceive speech sounds before language development, an extended period without the potential for auditory restoration though hearing aids has a negative impact on speech prosody perception. Moreover, it is predicted that even with CIs, when alterations in speech prosody contribute to changes in the original meaning, comprehension of spoken language remains challenging for CI users. For Korean, especially for spoken language, PWs are often used with a positive meaning, and words belonging to NW (i.e., so, where) are frequently used in everyday life in a negative sense when they are not used as interrogative pronouns [39,40]. In our study, as shown in Table 3, in the CI group, the median values for positive prosody condition were higher than the median values for negative prosody conditions in the PW task. On the other hand, in the NW task, the median values for the positive rhythmic conditions in both word task and word combination task were lower than the median values for the negative prosody conditions. Consequently, it can be expected that PW undergoes a transformation from its inherent positive meaning to a negative meaning, while the opposite occurs in NW, causing confusion in the perception of speech sound meaning and potentially having a negative impact. In terms of speech prosody production, no significant differences between the two groups were observed. These findings imply that even if the CI users can speak the sounds they perceive, it should not be assumed that they have understood them correctly.
In sum, findings of this study emphasize the need for an assessment tool focusing on prosodic elements of speech in clinical environments—even if audibility can be restored through CIs, an important element, prosody, needs to be assessed as well in order to accurately evaluate one’s speech performance. In addition, development of a CI signal processing algorithm that takes suprasegmental factors of speech sound into consideration is needed. As prosody is a critical element to deliver and perceive emotions, CI users’ ability to perceive and produce the prosodic element needs to be thoroughly assessed and this will also help with their aural rehabilitation plans. Subsequent studies with larger sample sizes and a larger variety of participant characteristics are necessary to further examine the need and potential of the inclusion of the prosodic element in audiological assessment and rehabilitation.